Right panel
Modifications of inherent network parameters
Now we focus on the functions of right panel.
 Right panel of network visualization page
Network Analysis
You can reduce the network complexity and focus on the key drivers of your network here by selecting different radio buttons.
- Community detection
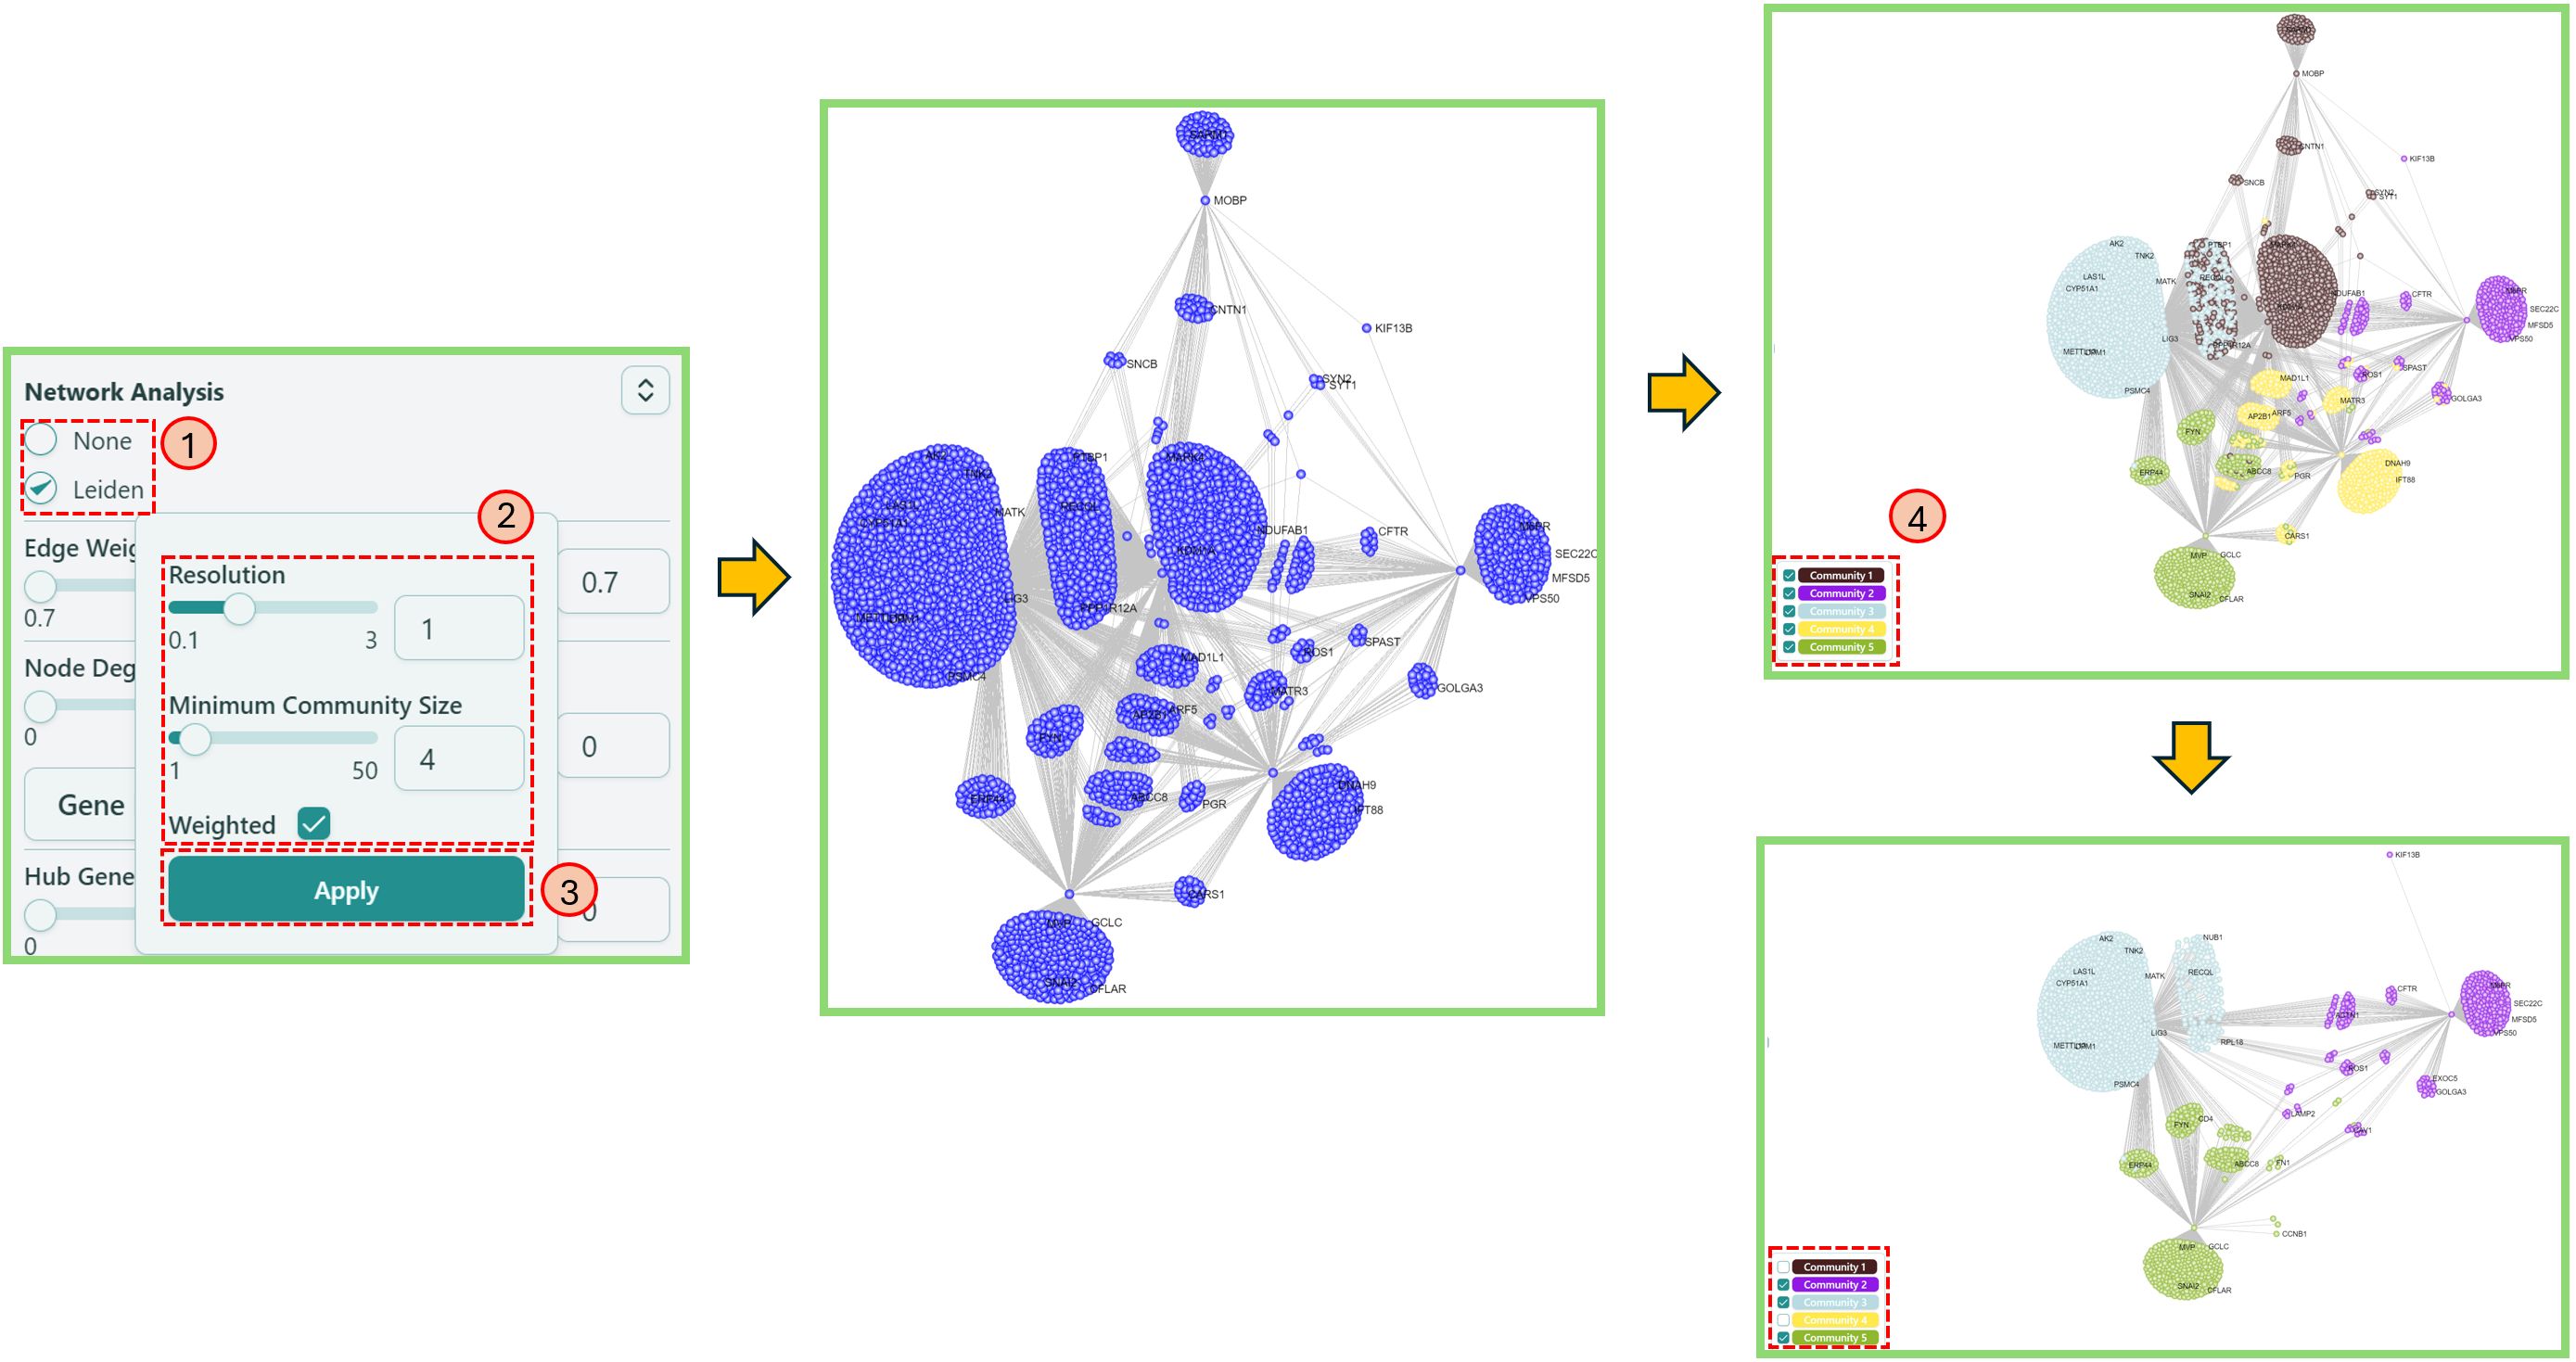
We offer community detection algorithm Leiden [1] in our tool, you can easily use this algorithm to find possible communities in the network, based on your own choice of Resolution, Minimum Community Size and Weighted. Here is a help video.
- Click Leiden.
- Select proper Resolution and Minimum Community Size, check or uncheck Weighted, to involve edge weight or not.
- Click Apply.
- Select/Deselect communities to keep/drop the detected communities in the network.
 Community detection
- Edge Weight Cut-off
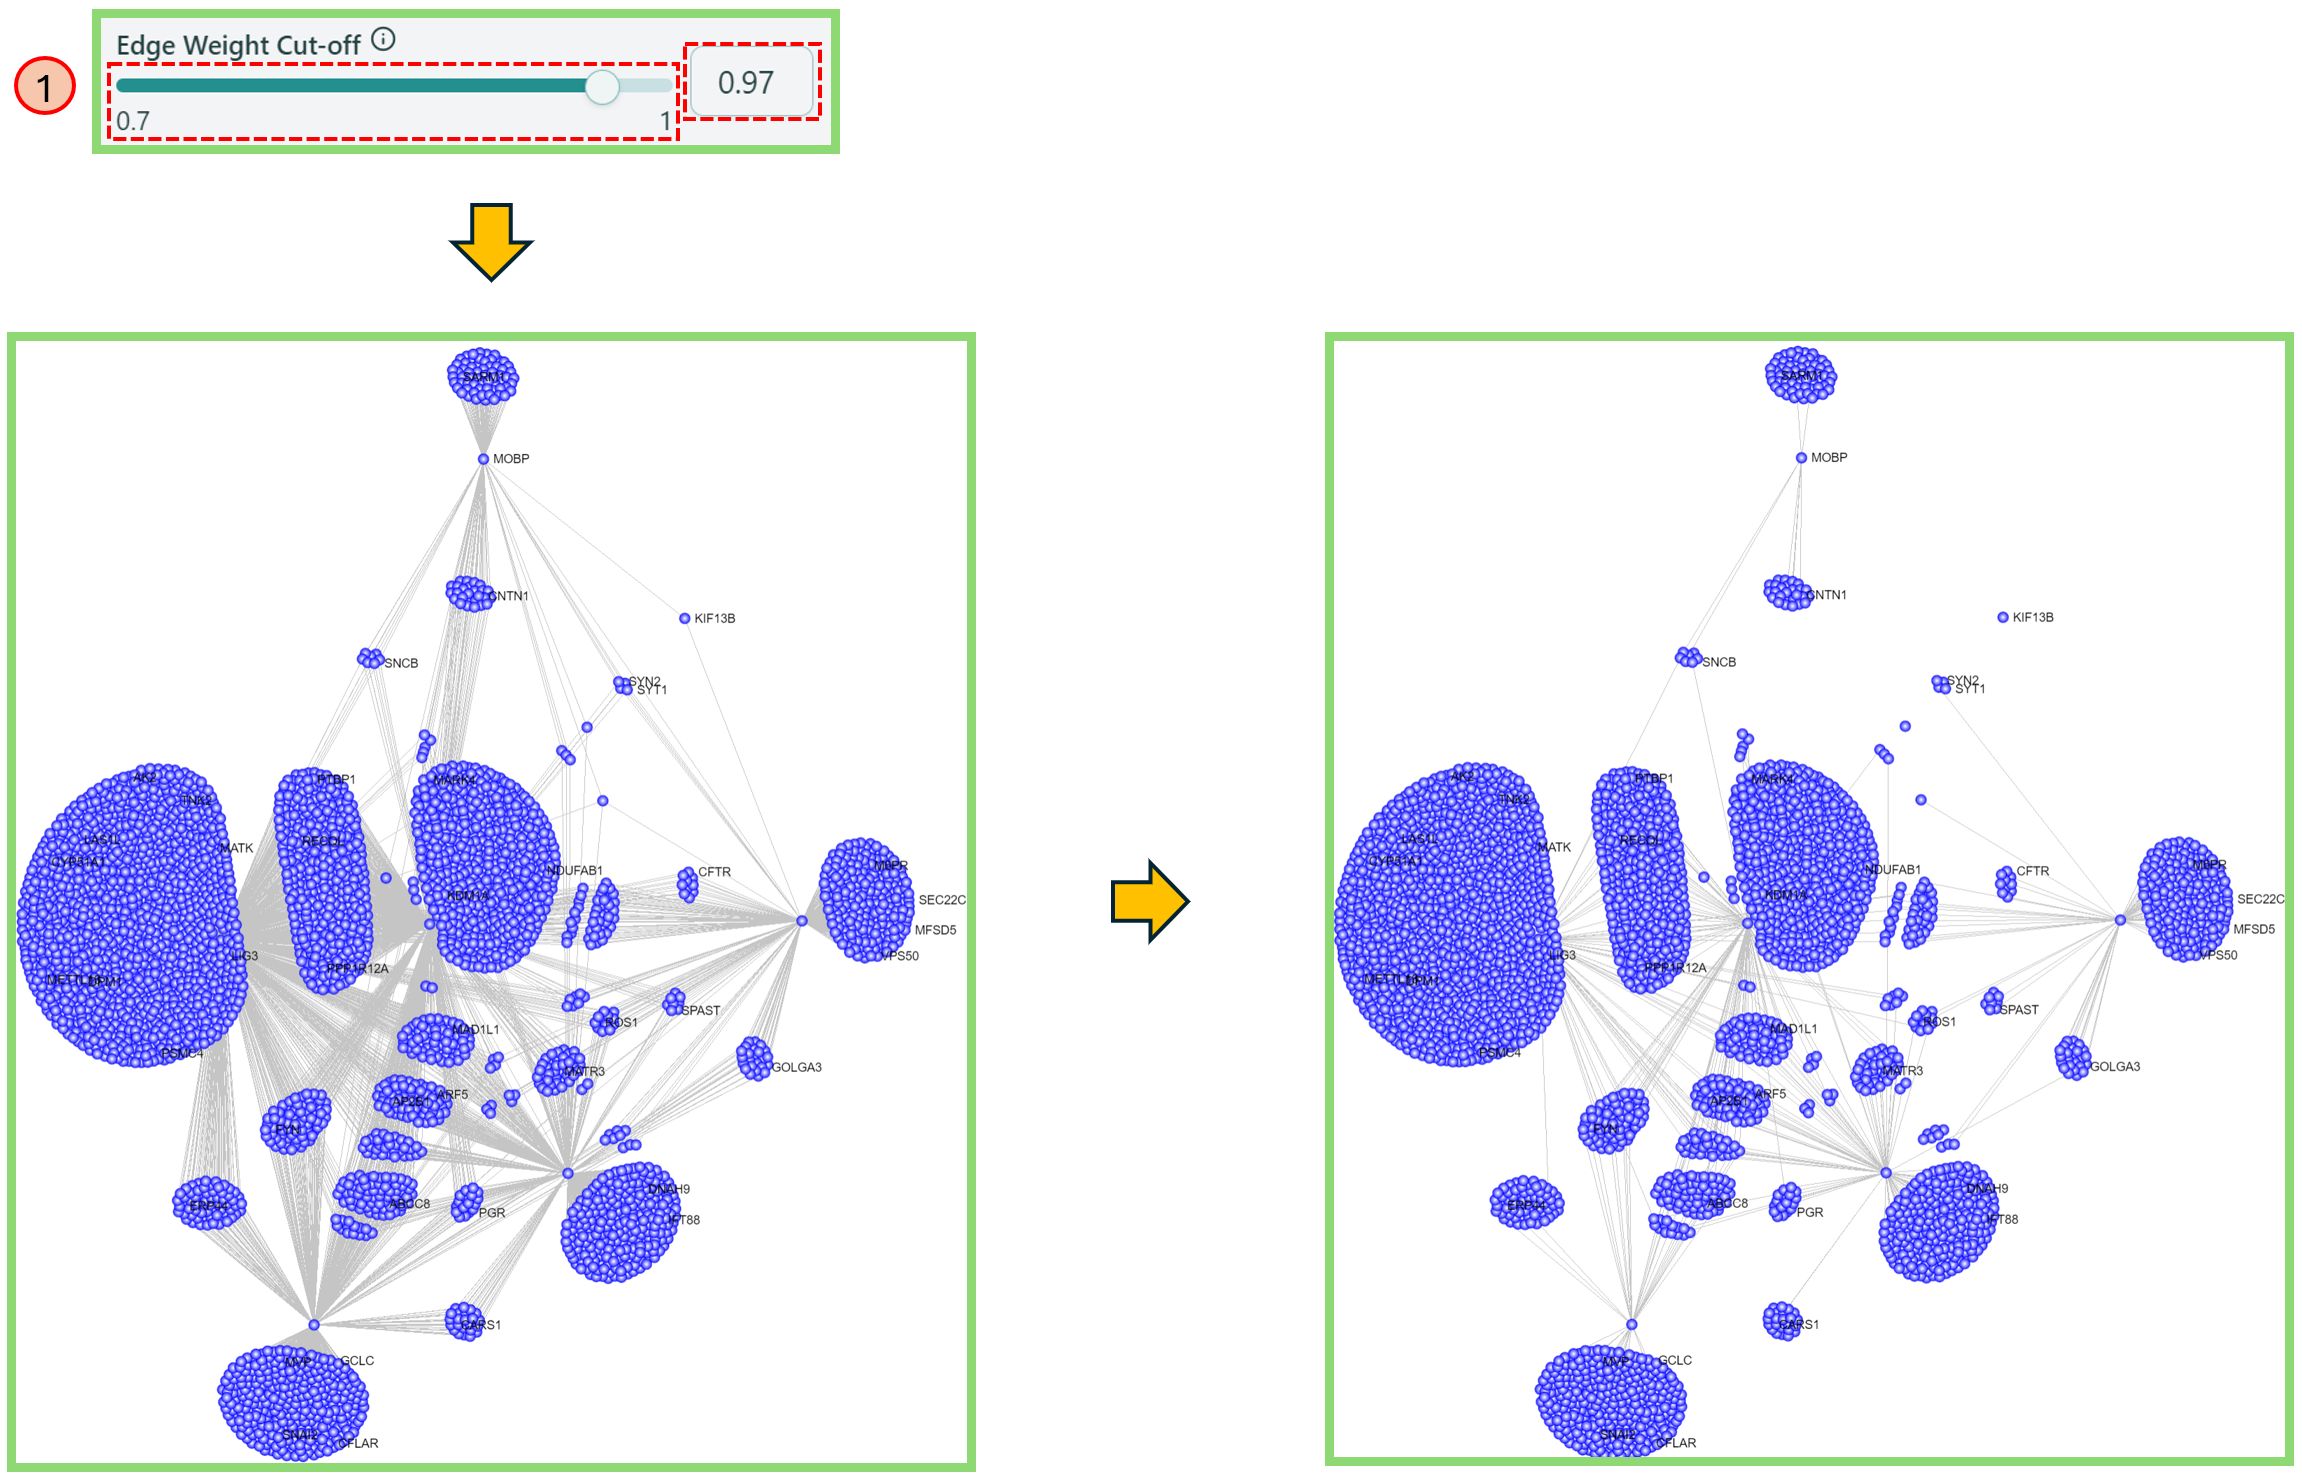
This feature allows you to filter out the nodes with less edge weight, so that you can focus more on the clustered nodes.
- Use the range slider or directly type in the number to select an appropriate value and filter out the nodes with edge weight less than the selected value.
 Edge weight cut-off
- Node Degree Cut-off
This feature allows you to shrink the network based on the node degree of specific features.
- In the dropdown list, you can select your preferred feature.
- Use the range slider or directly type in the proper number to select an appropriate gene degree, making the network reduced as you want. We currently provide 2 types of values to reduce the network — Gene degree and Tissue Specificity values.
 Node degree cut-off
- Hub Genes
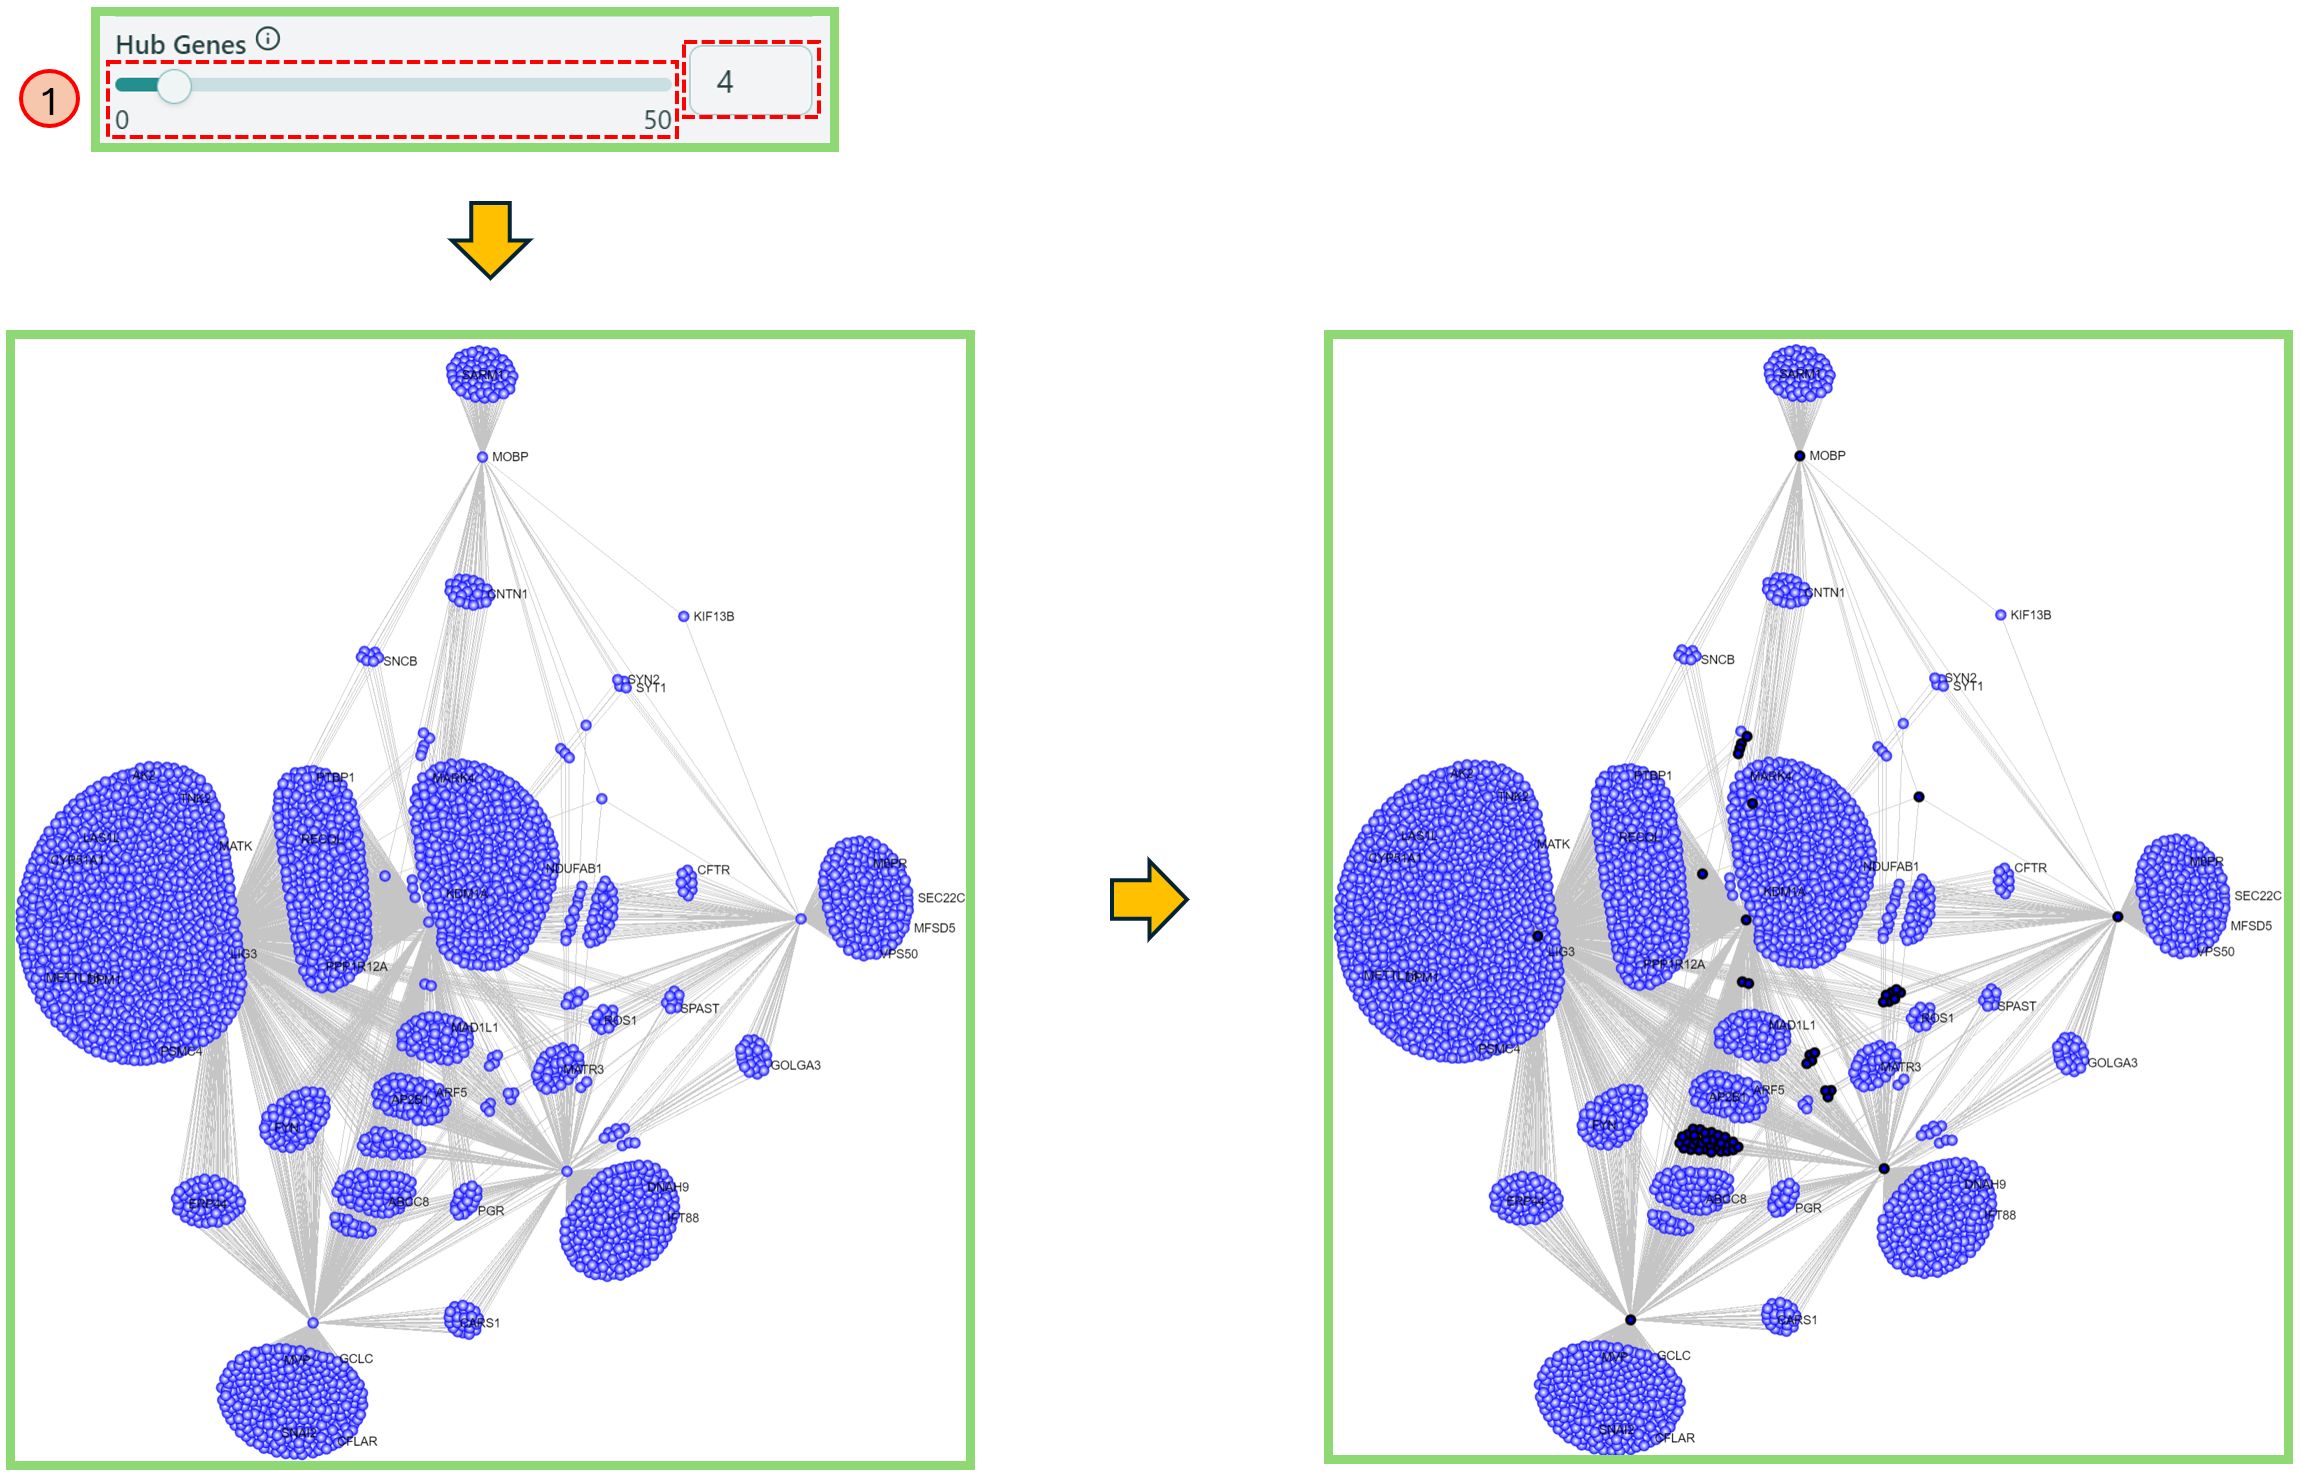
Hub Genes will highlight the nodes only with larger or equal to the number of edges defined by yourself.
- Use the range slider or directly type in the proper number to select an appropriate value to highlight the nodes with node degrees more than or equal to the selected value.
 Hub genes
Network Info
When the network is rendered, the basic information of the network is shown here, i.e. total nodes, total edges.
You can also click Show Details button after selecting the nodes in the network. Please refer to Node Details & GSEA in Network visualization board section for more information.
Legends
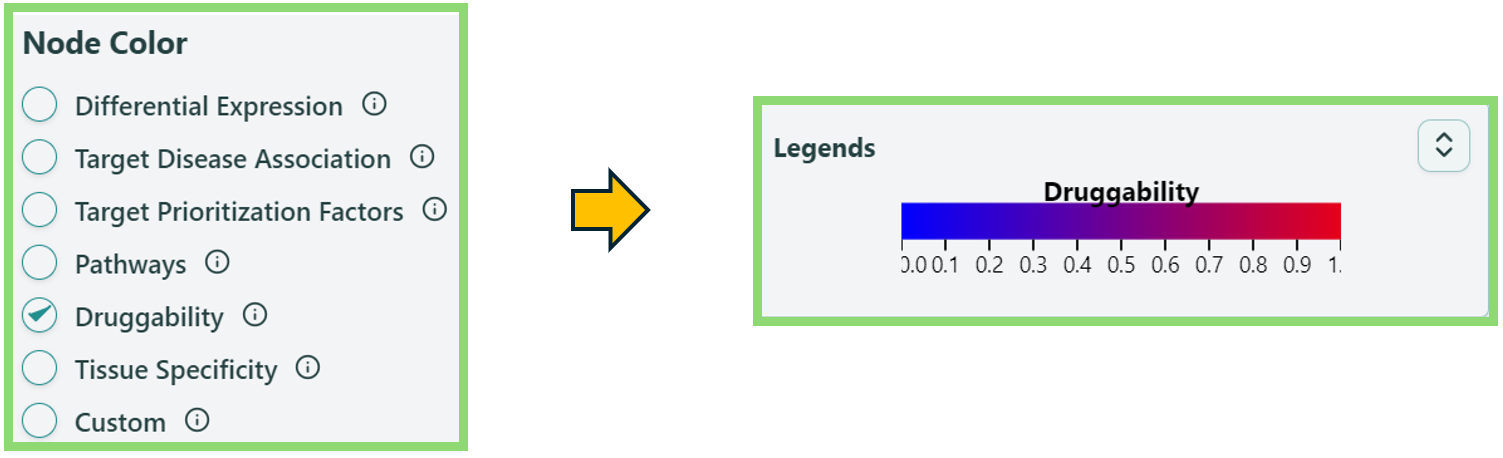
You can see the Legend of each feature in Node Color section.
- Choose a feature in Node Color section on the Left panel, then navigate to Legends section on the Right panel to get the legend of a specific feature.
 Legends when selecting Druggability in Node Color
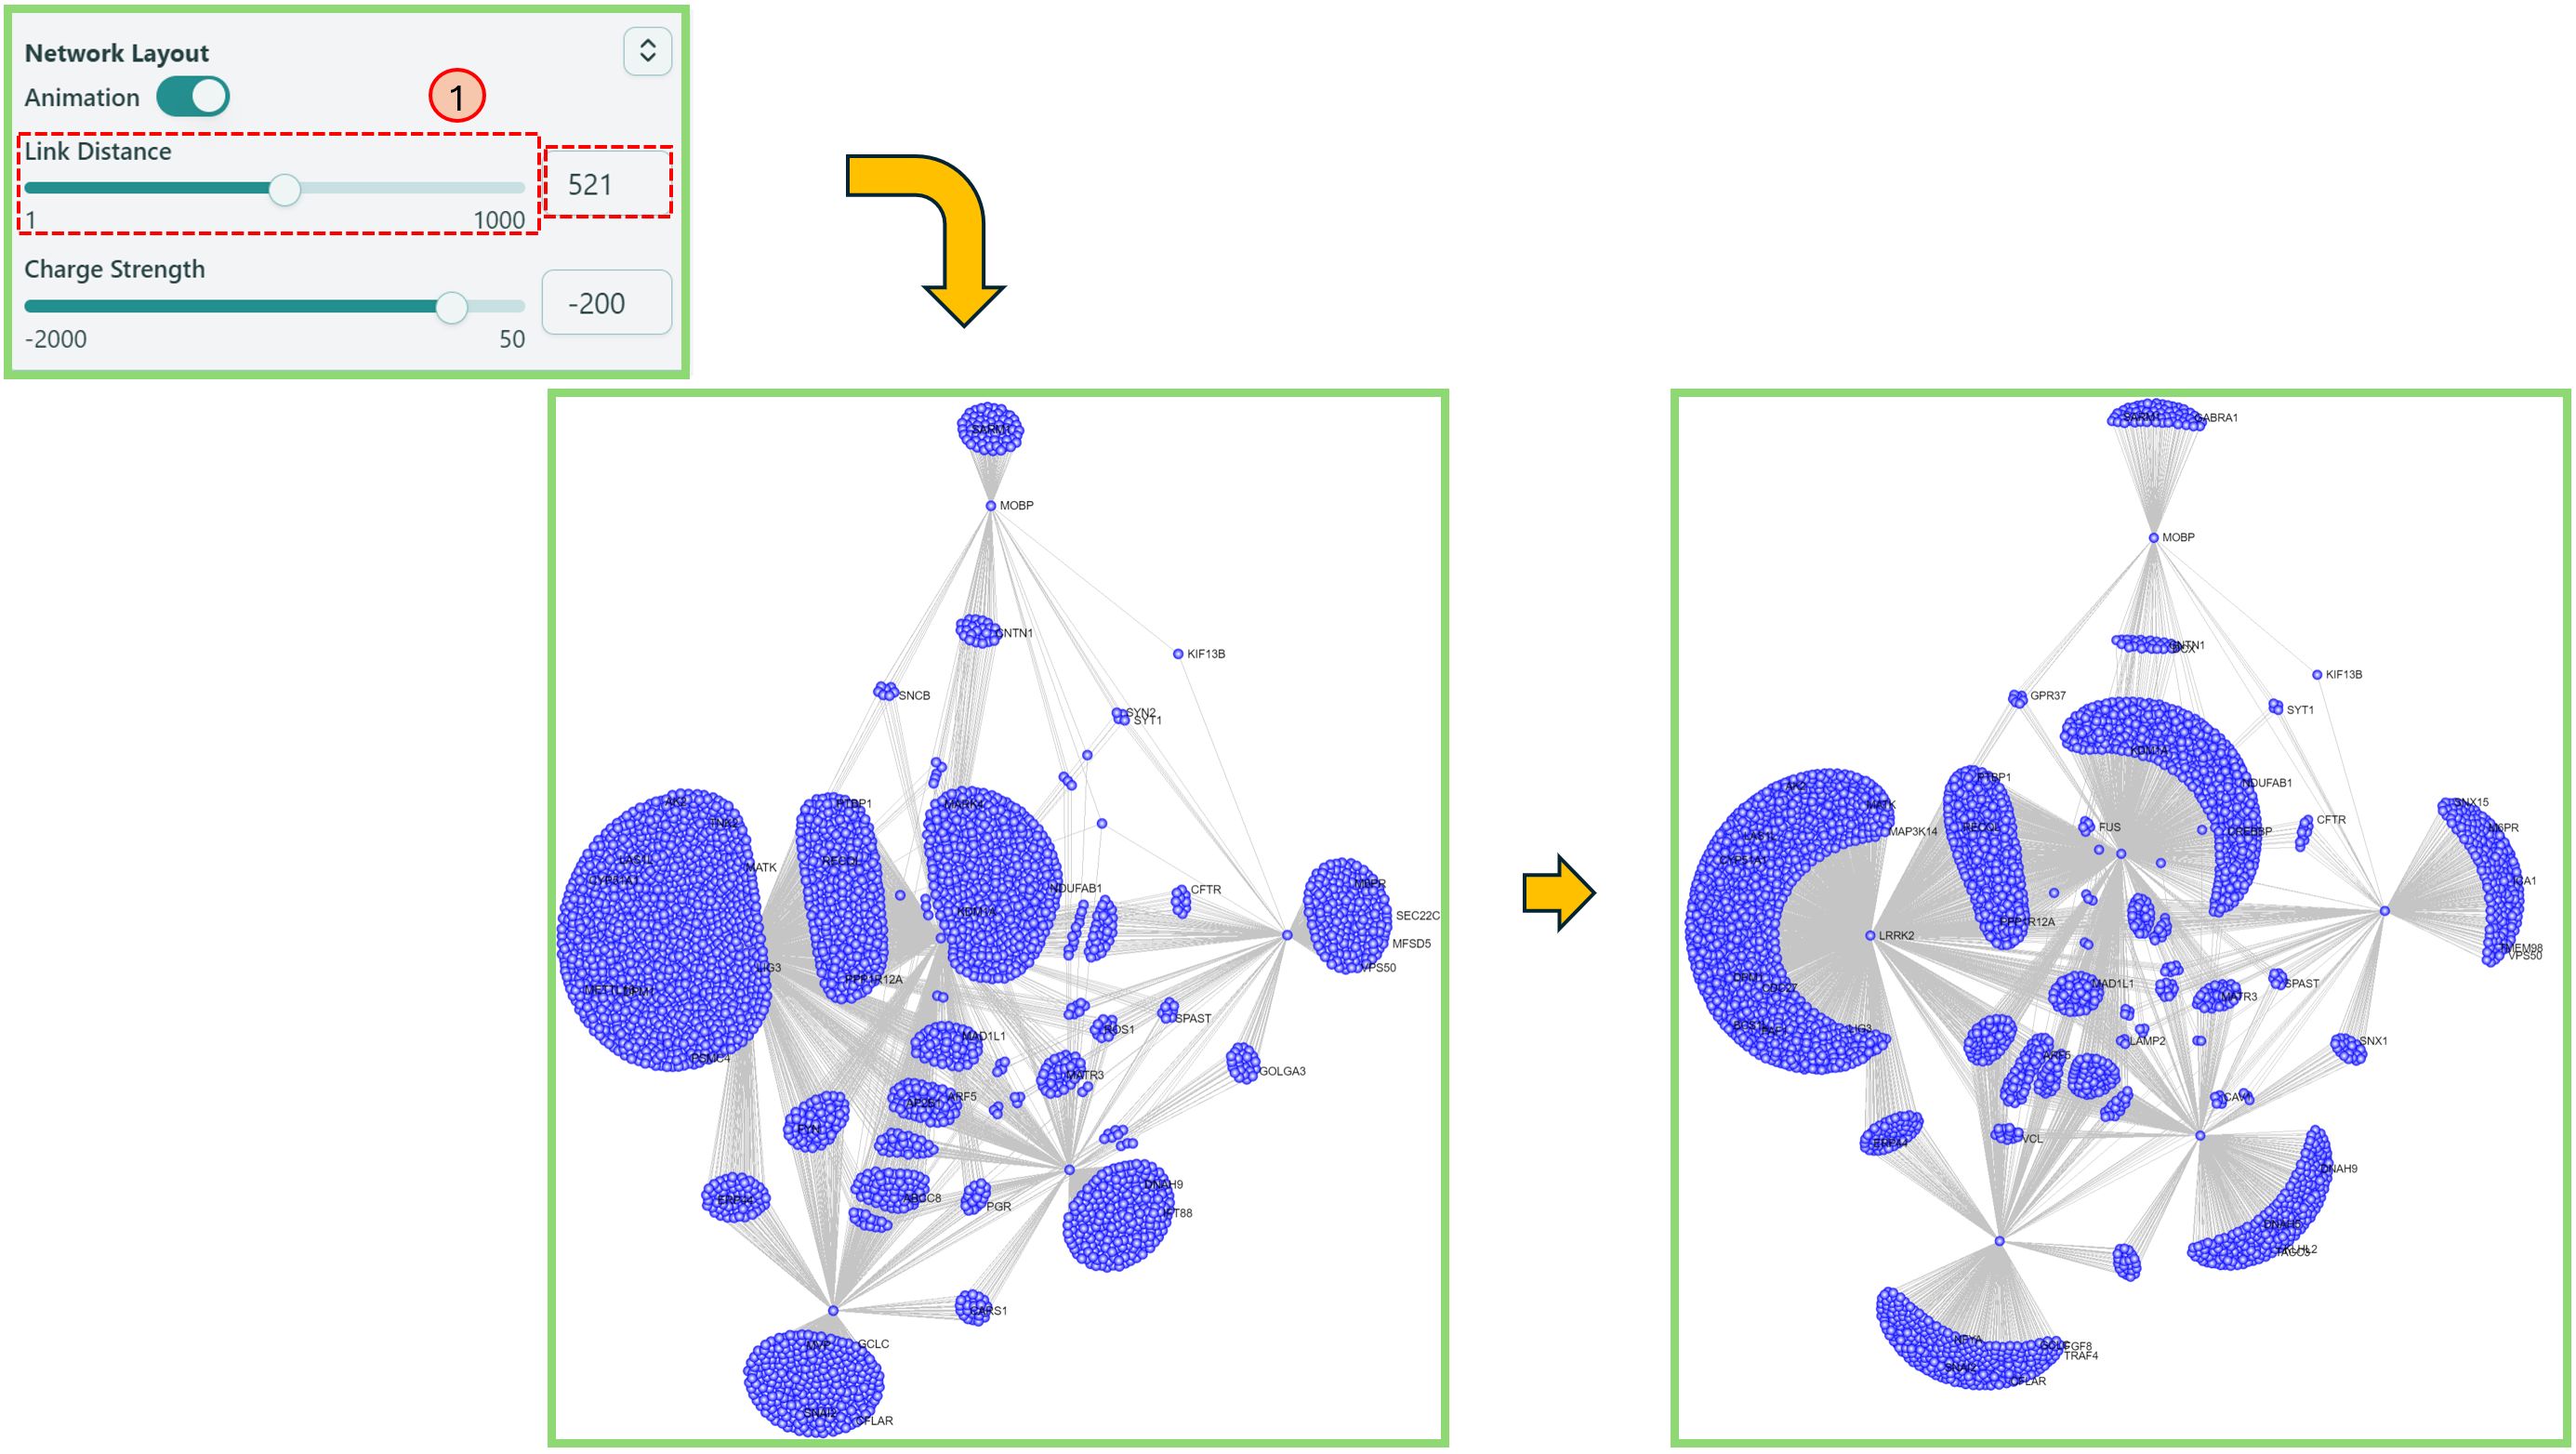
Network Layout
You can make the node clusters more separated.
- Use the range slider or directly type in the proper number in Link Distance, this will make the edge of the network longer, helping the clusters separated from each other.
- Use the range slider or directly type in the proper number in Charge Strength, this will separate the nodes from each other.
 Change Link Distance
 Change Charge Strength
You can also use “Stop Animation” button to stop dancing of the network.
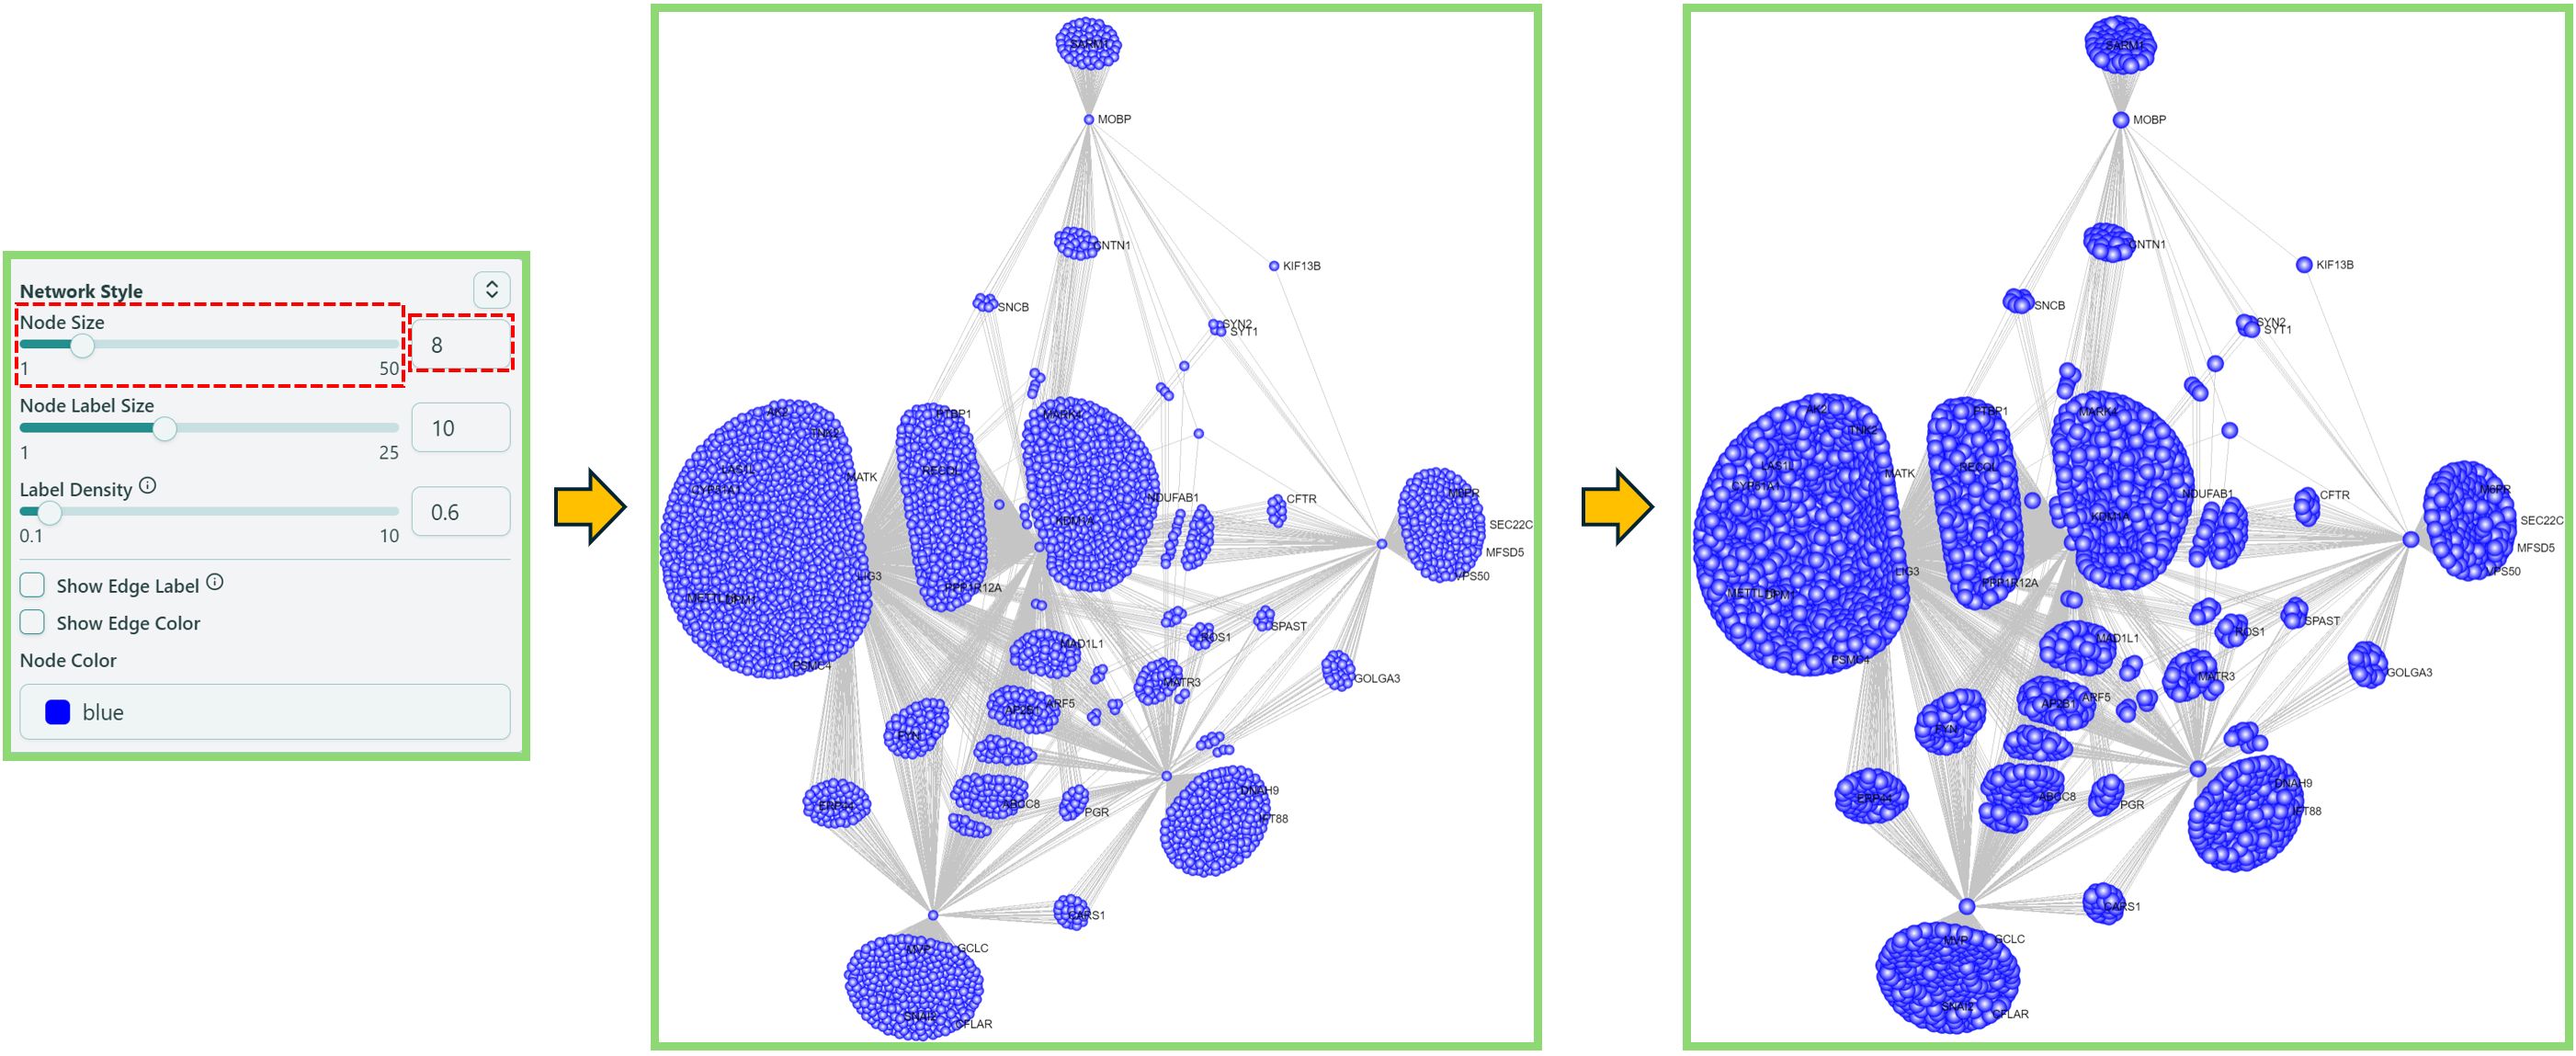
Network Style
You can change basic parameters of the network.
- Node Size
You can make node size larger/smaller.
 Change Node Size
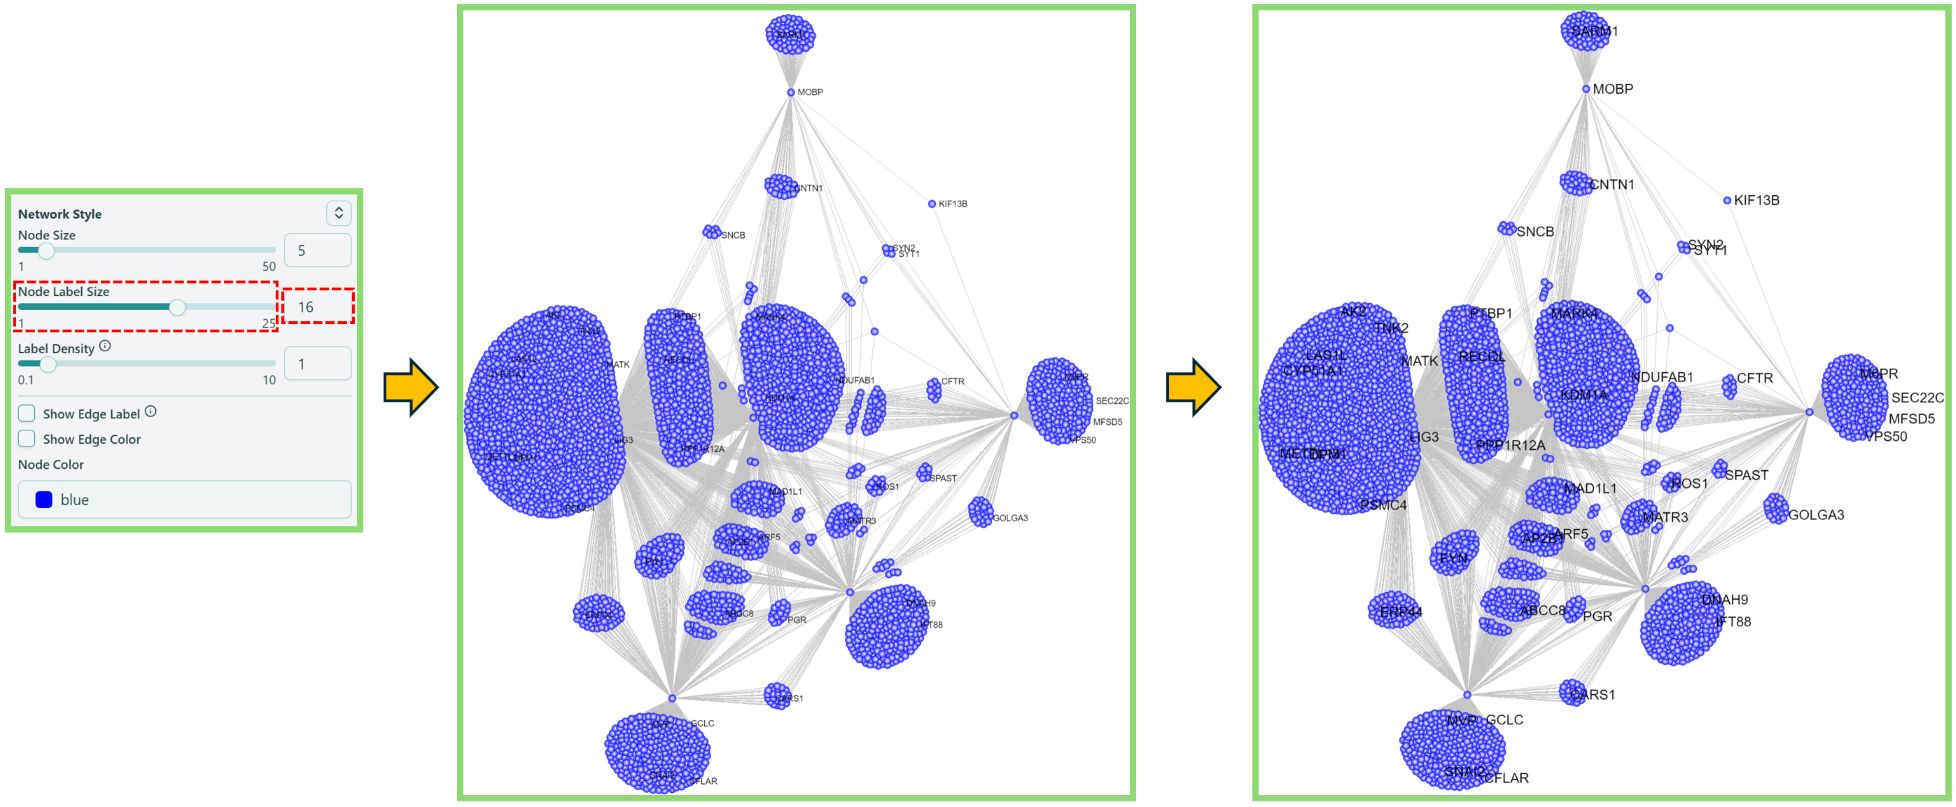
- Node Label Size
You can make node label size larger/smaller.
 Change Node Label Size
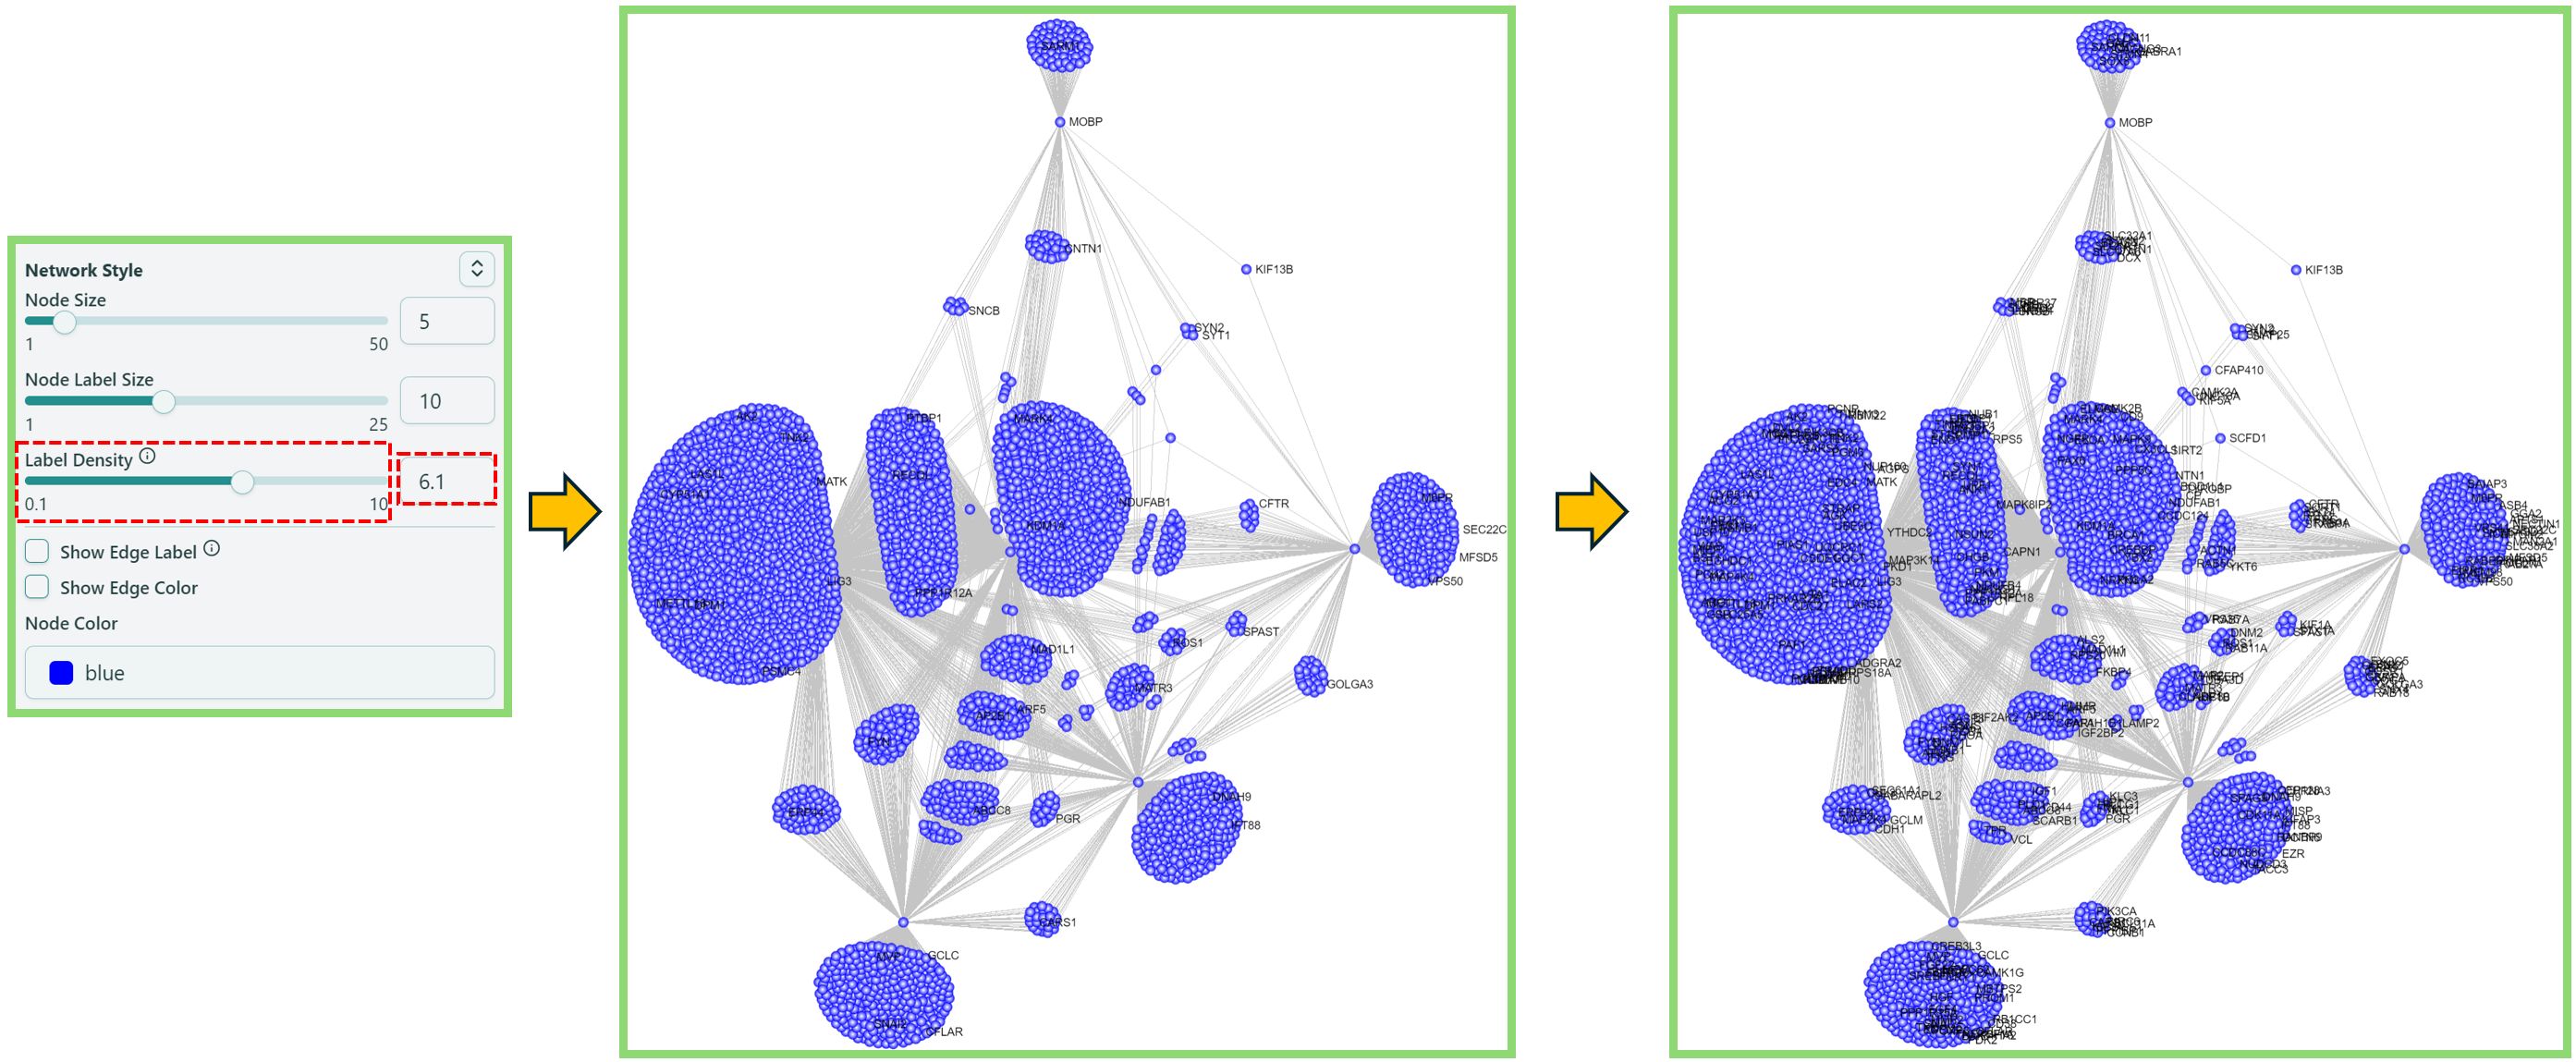
- Label Density
You can change the label density here.
 Change Label Density
- Show Edge Label
You can make edge label (edge weight) appear/disappear. To view more edge labels, simply zoom in the network.
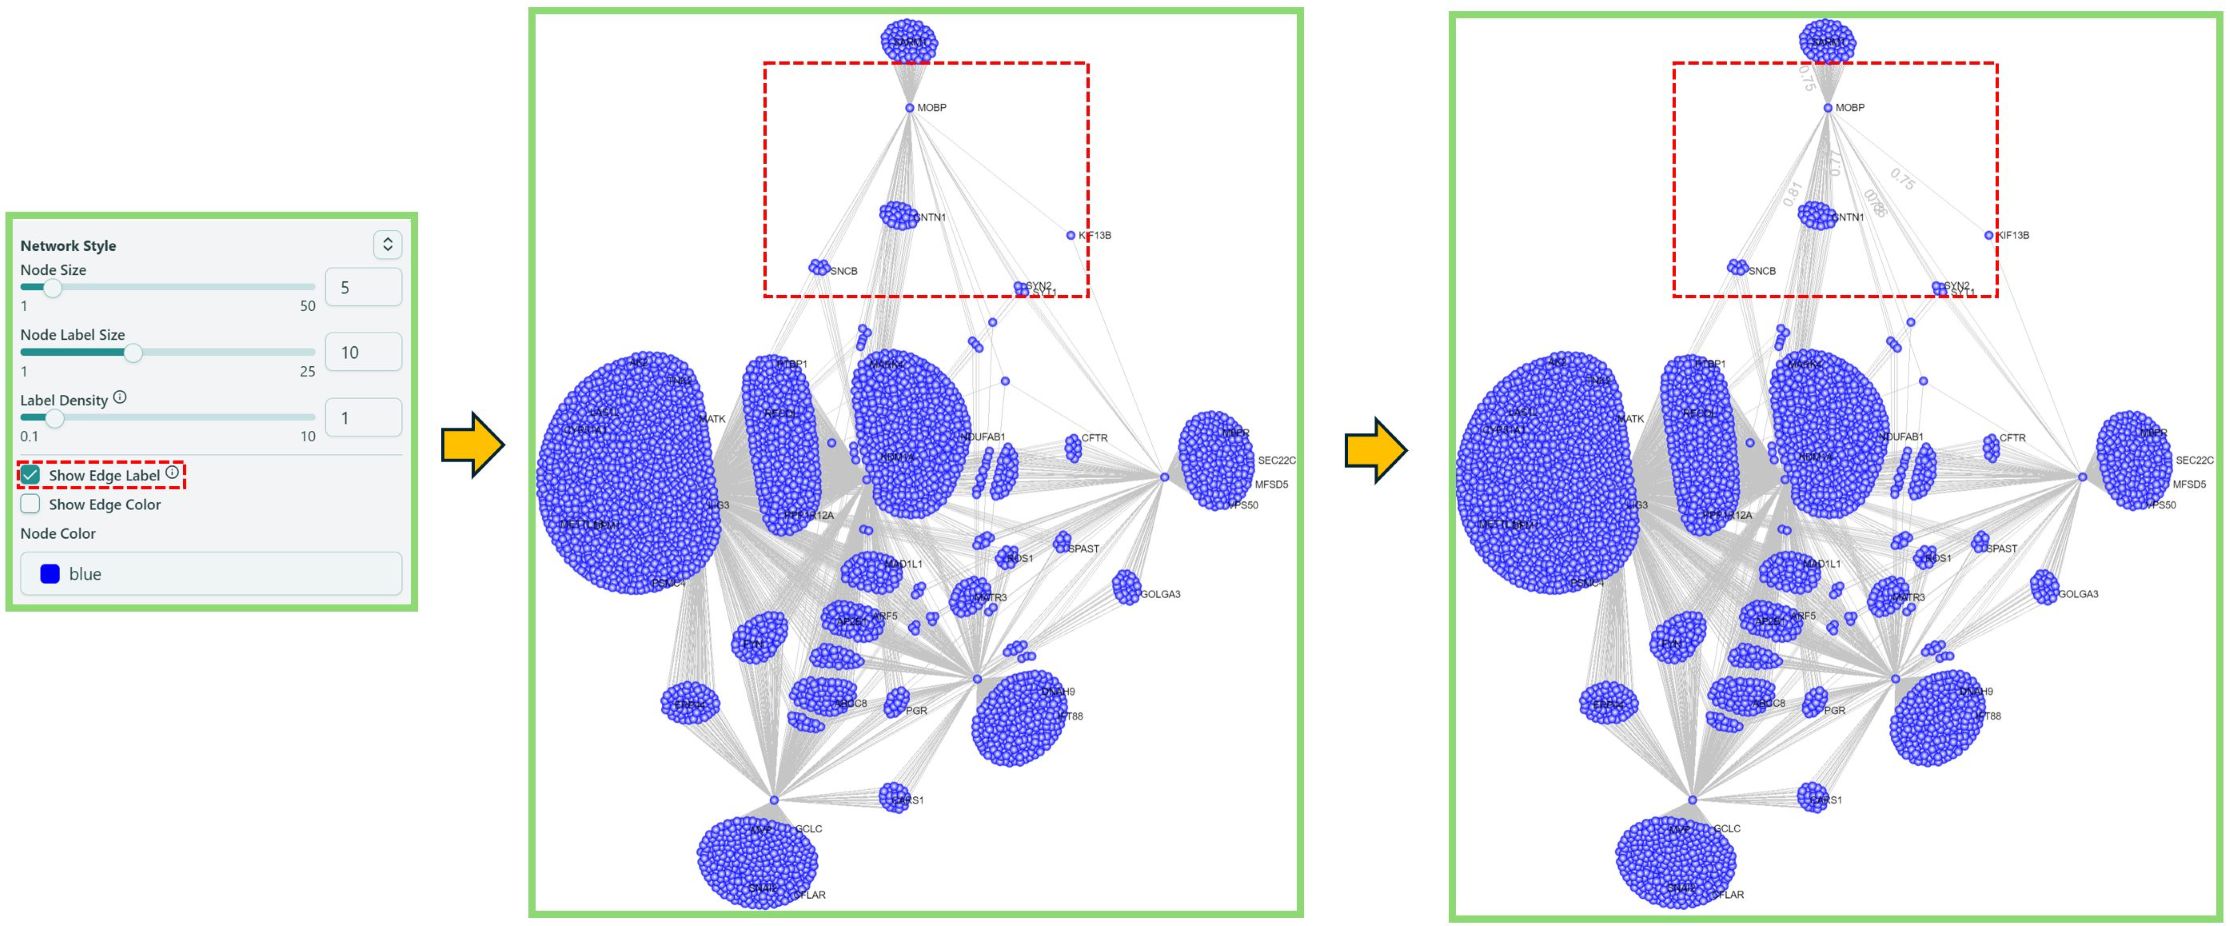 Show Edge Label
You can also refer to the information icon ![]() for the large network tips.
for the large network tips.
- Show Edge Color
You can change the edge color here. Please refer to the Legends section on the Right Panel for the color meaning.
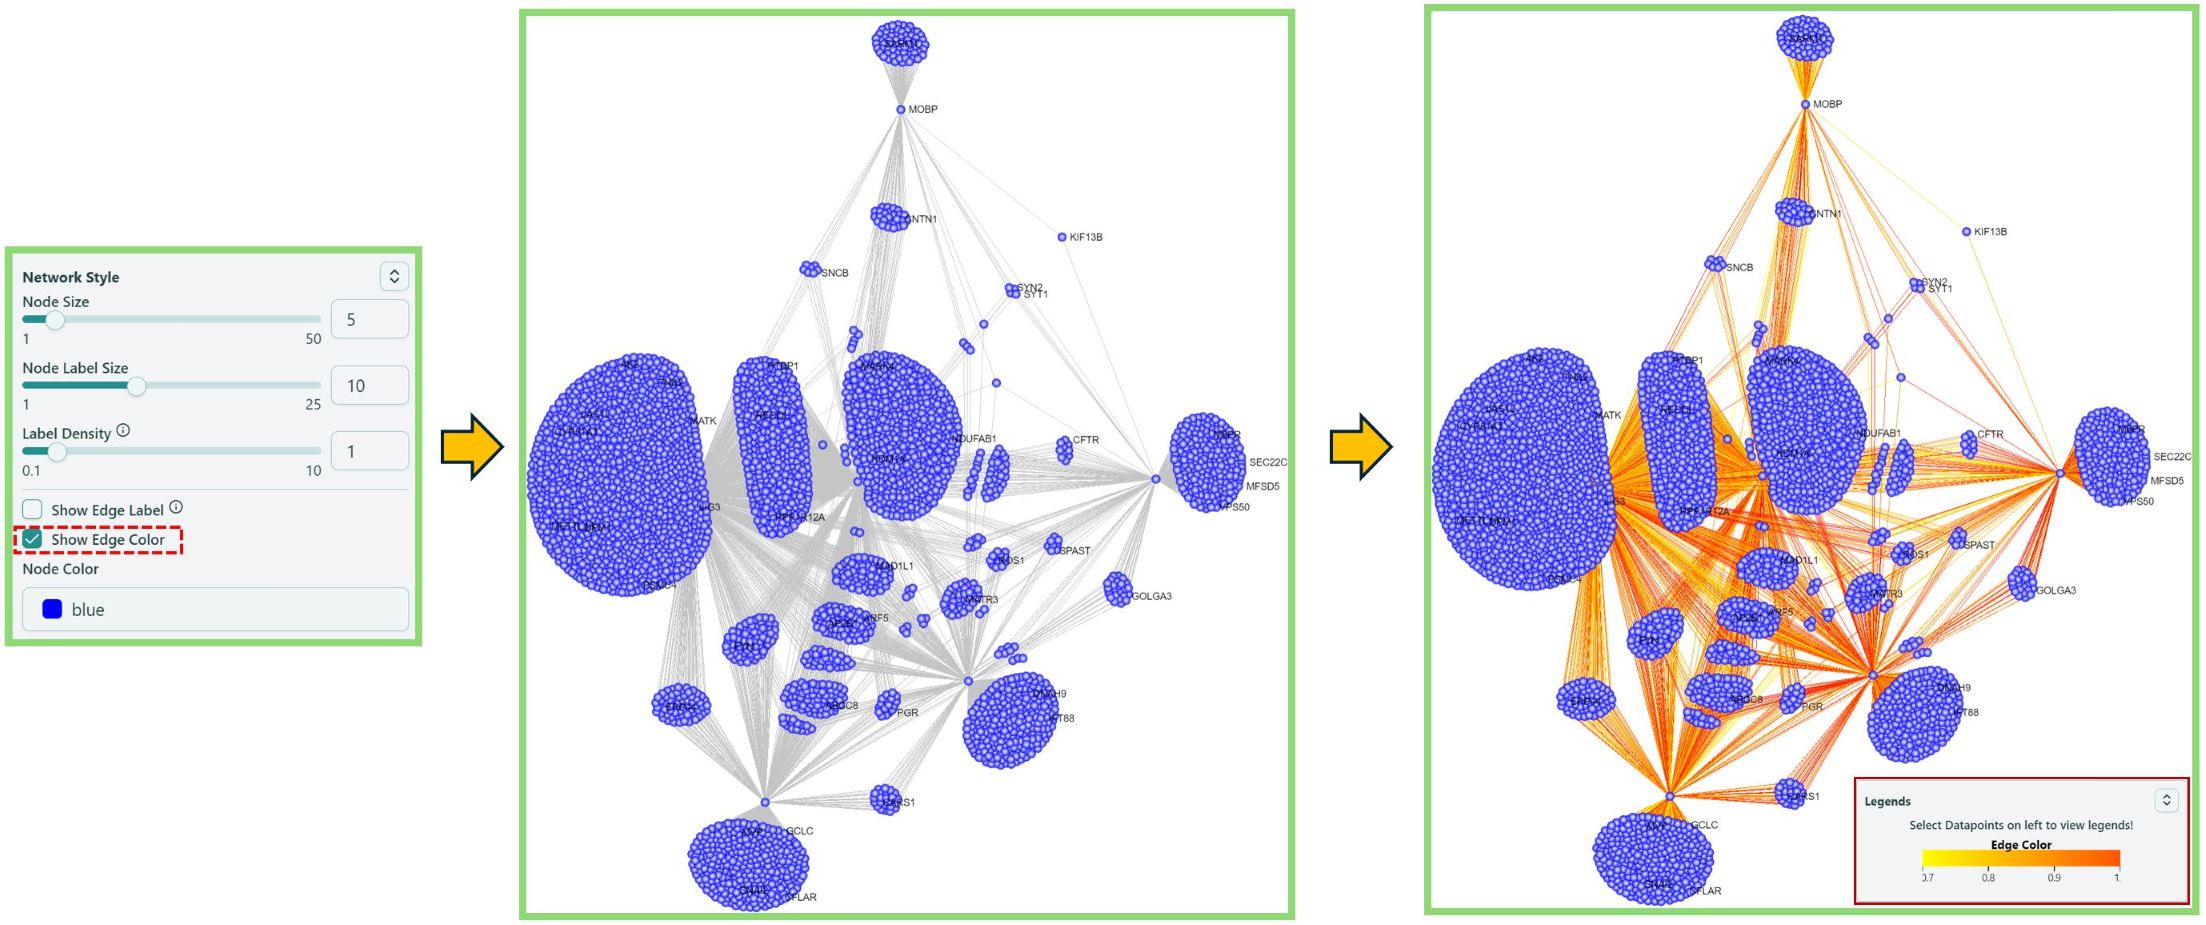 Show Edge Color
- Node Color
You can change the node color here, simply by selecting different color or type different color names.
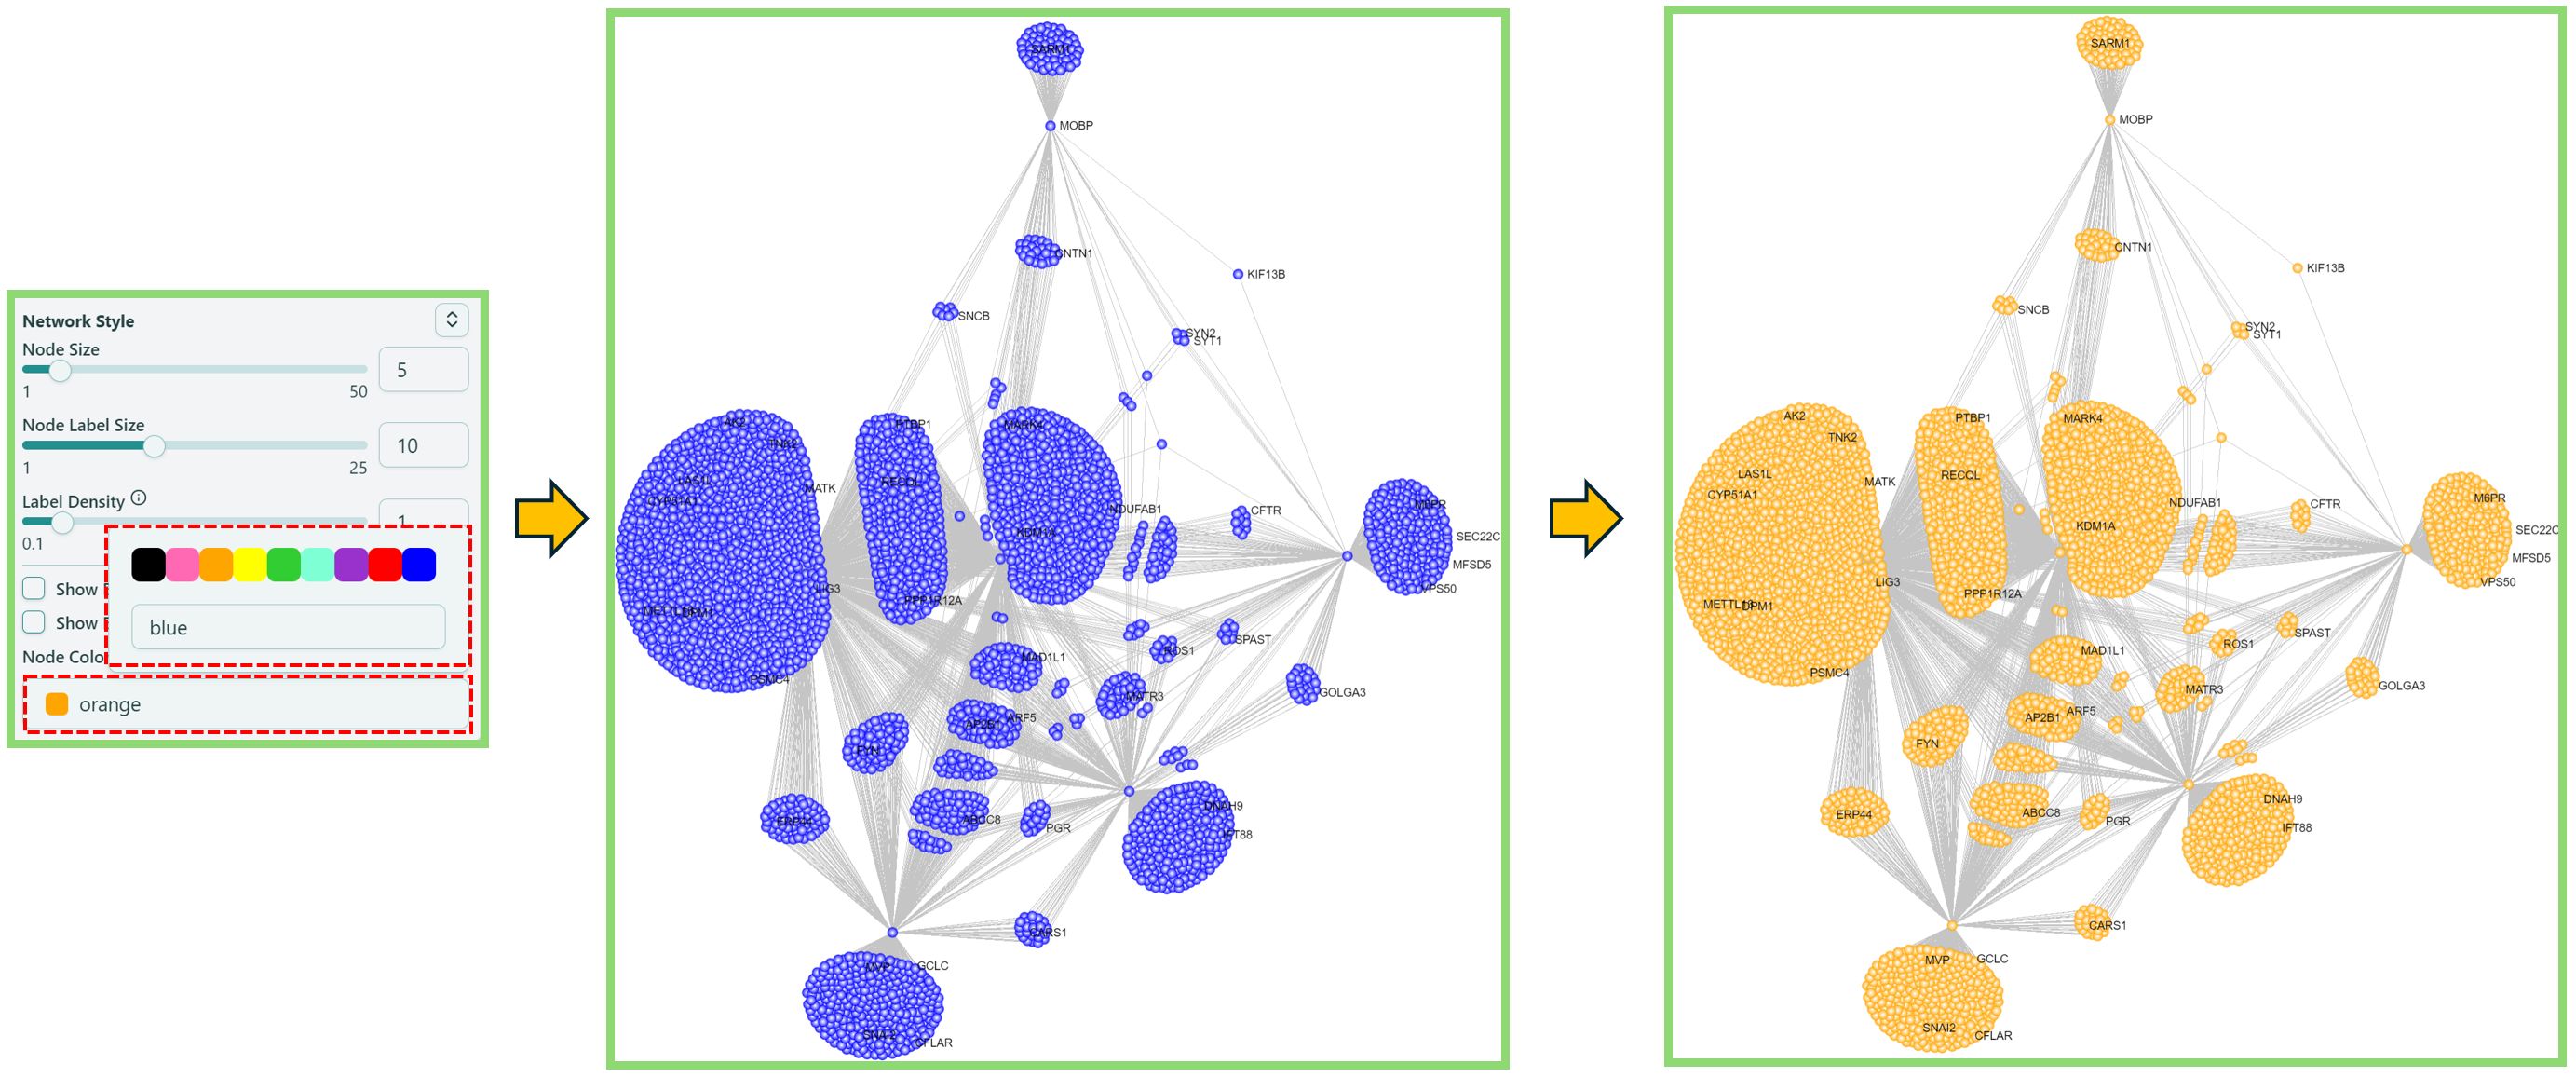 Change Node Color
Citation
[1] Traag, V. A., et al. « From Louvain to Leiden: Guaranteeing Well-Connected Communities ». Scientific Reports, vol. 9, no 1, décembre 2019, p. 5233. DOI.org (Crossref), doi: 10.1038/s41598-019-41695-z.