Network Visualization
Provide various functions for network analysis
Right now you enter the network visualization page, shown as below, where you can analyze your network based on your selections on Dashboard.
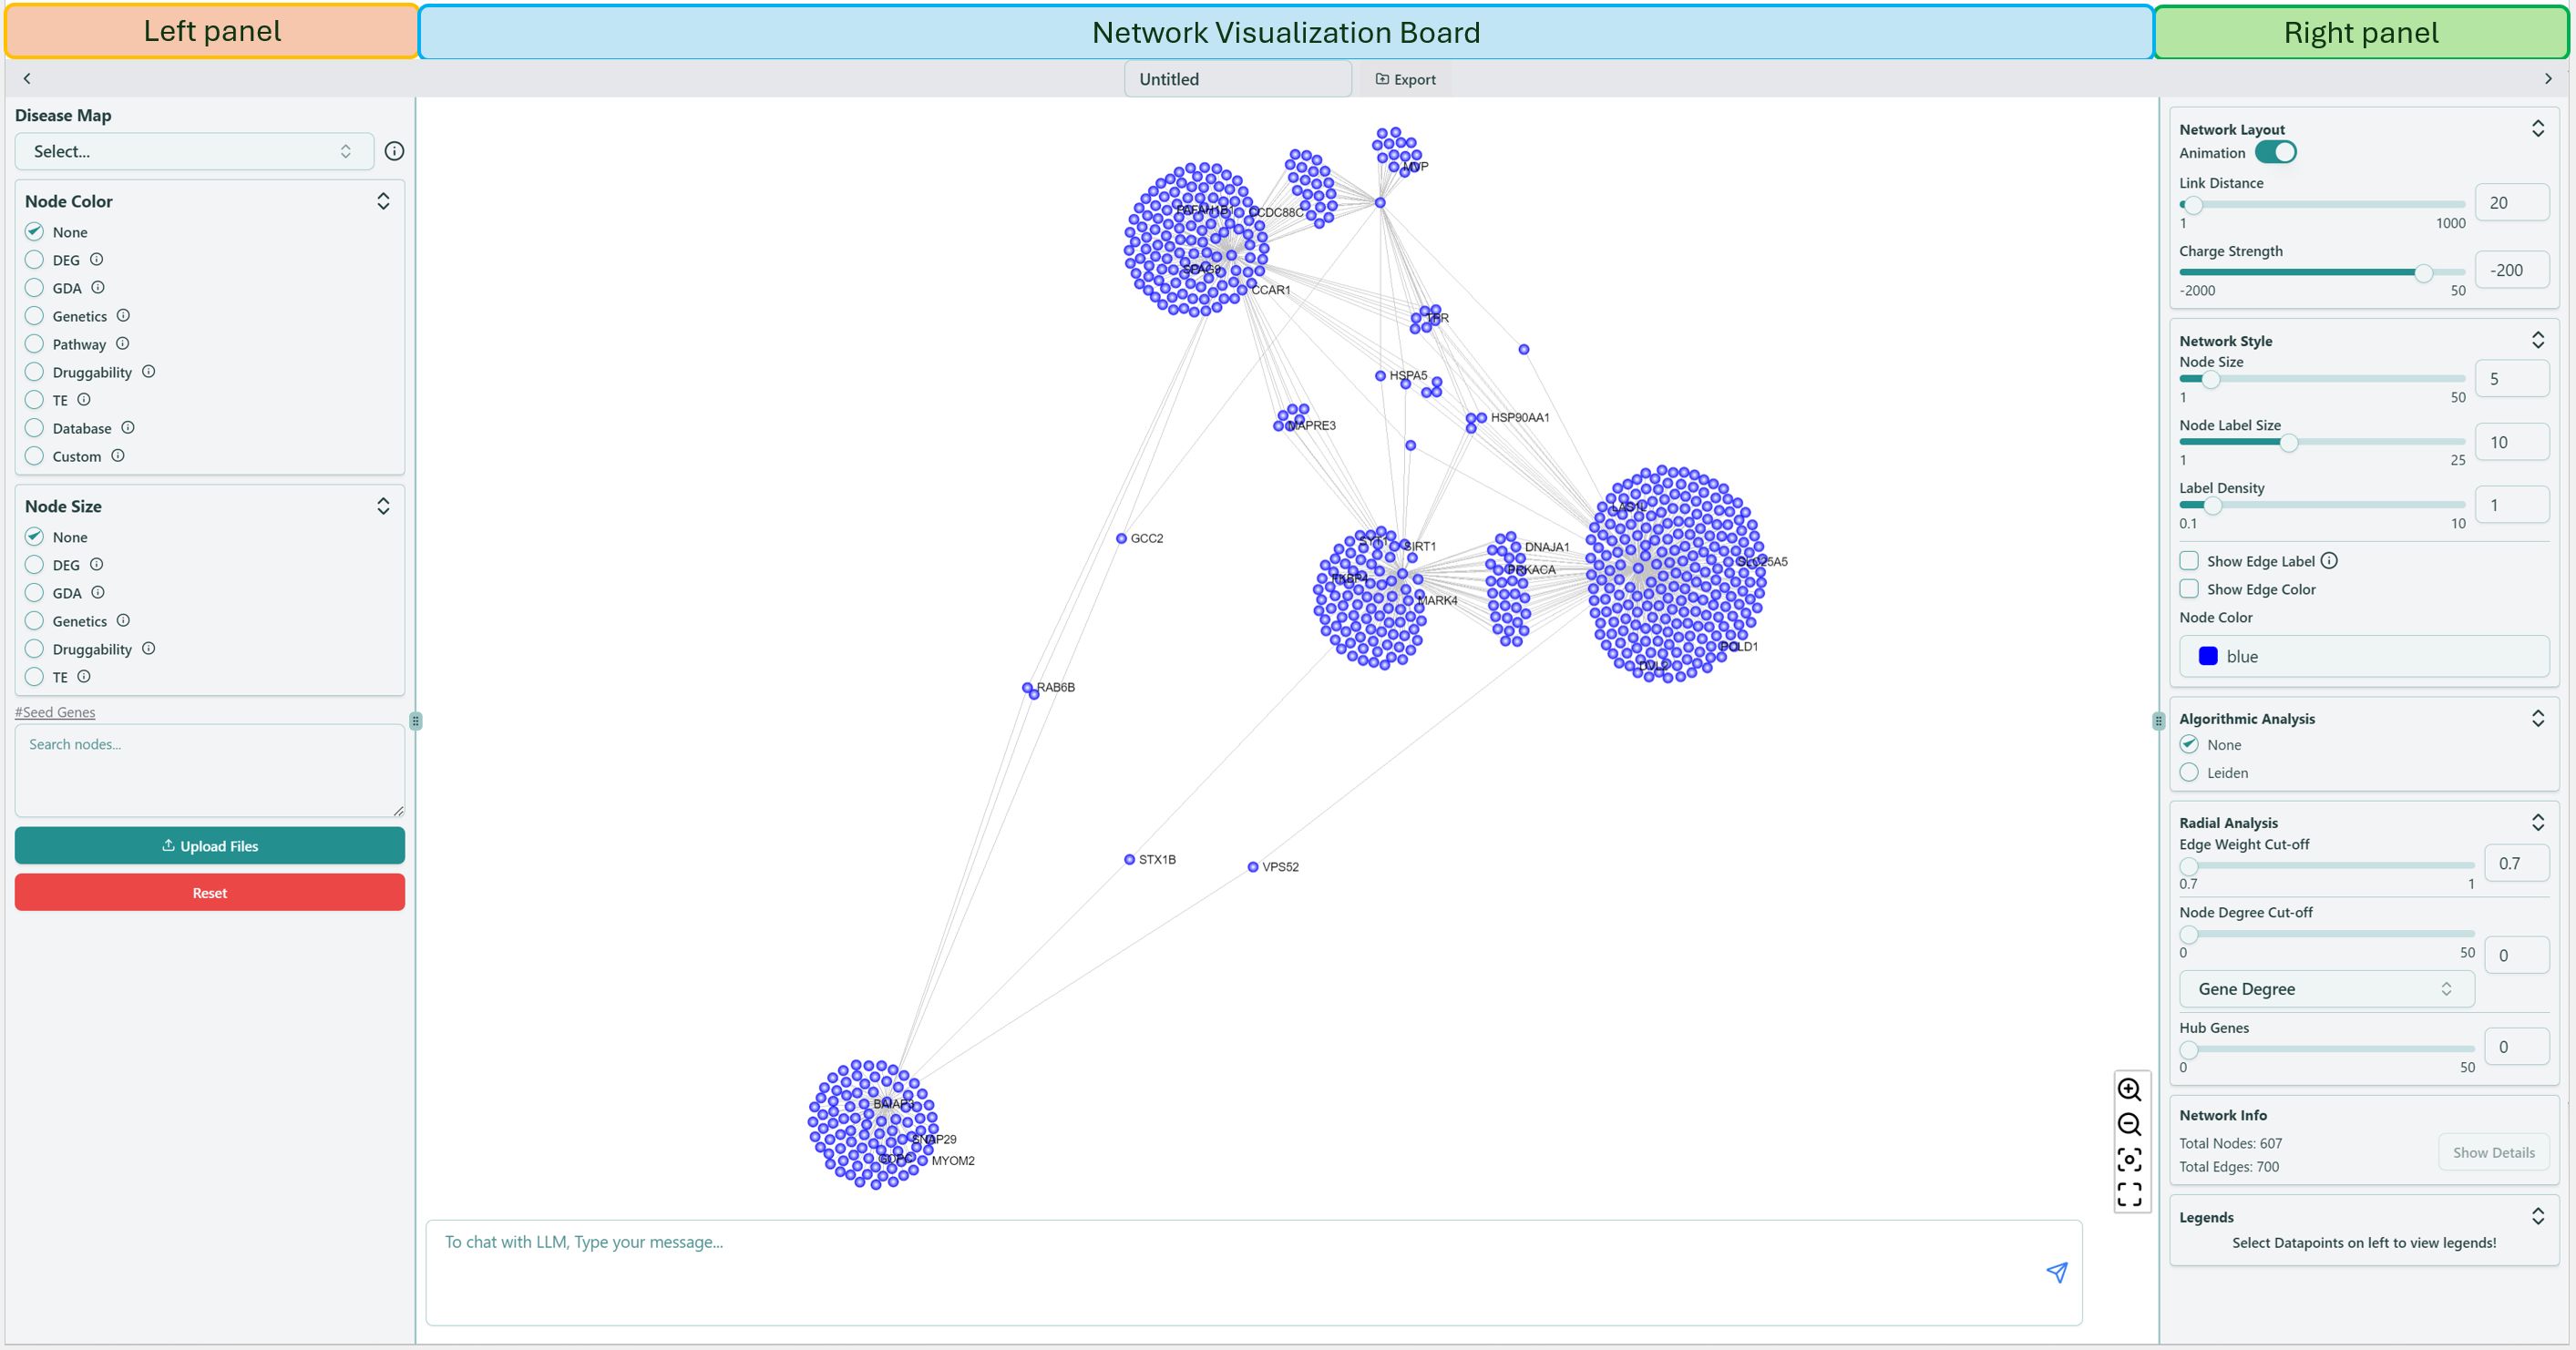 Network visualization page
Gene information
If you hover on an arbitrary gene (node), you are able to see the corresponding gene information, and all the genes connected with this hovered gene are also highlighted. If you click on a specific gene, a small window will show up on the upper right corner, giving you the details related to this genes.
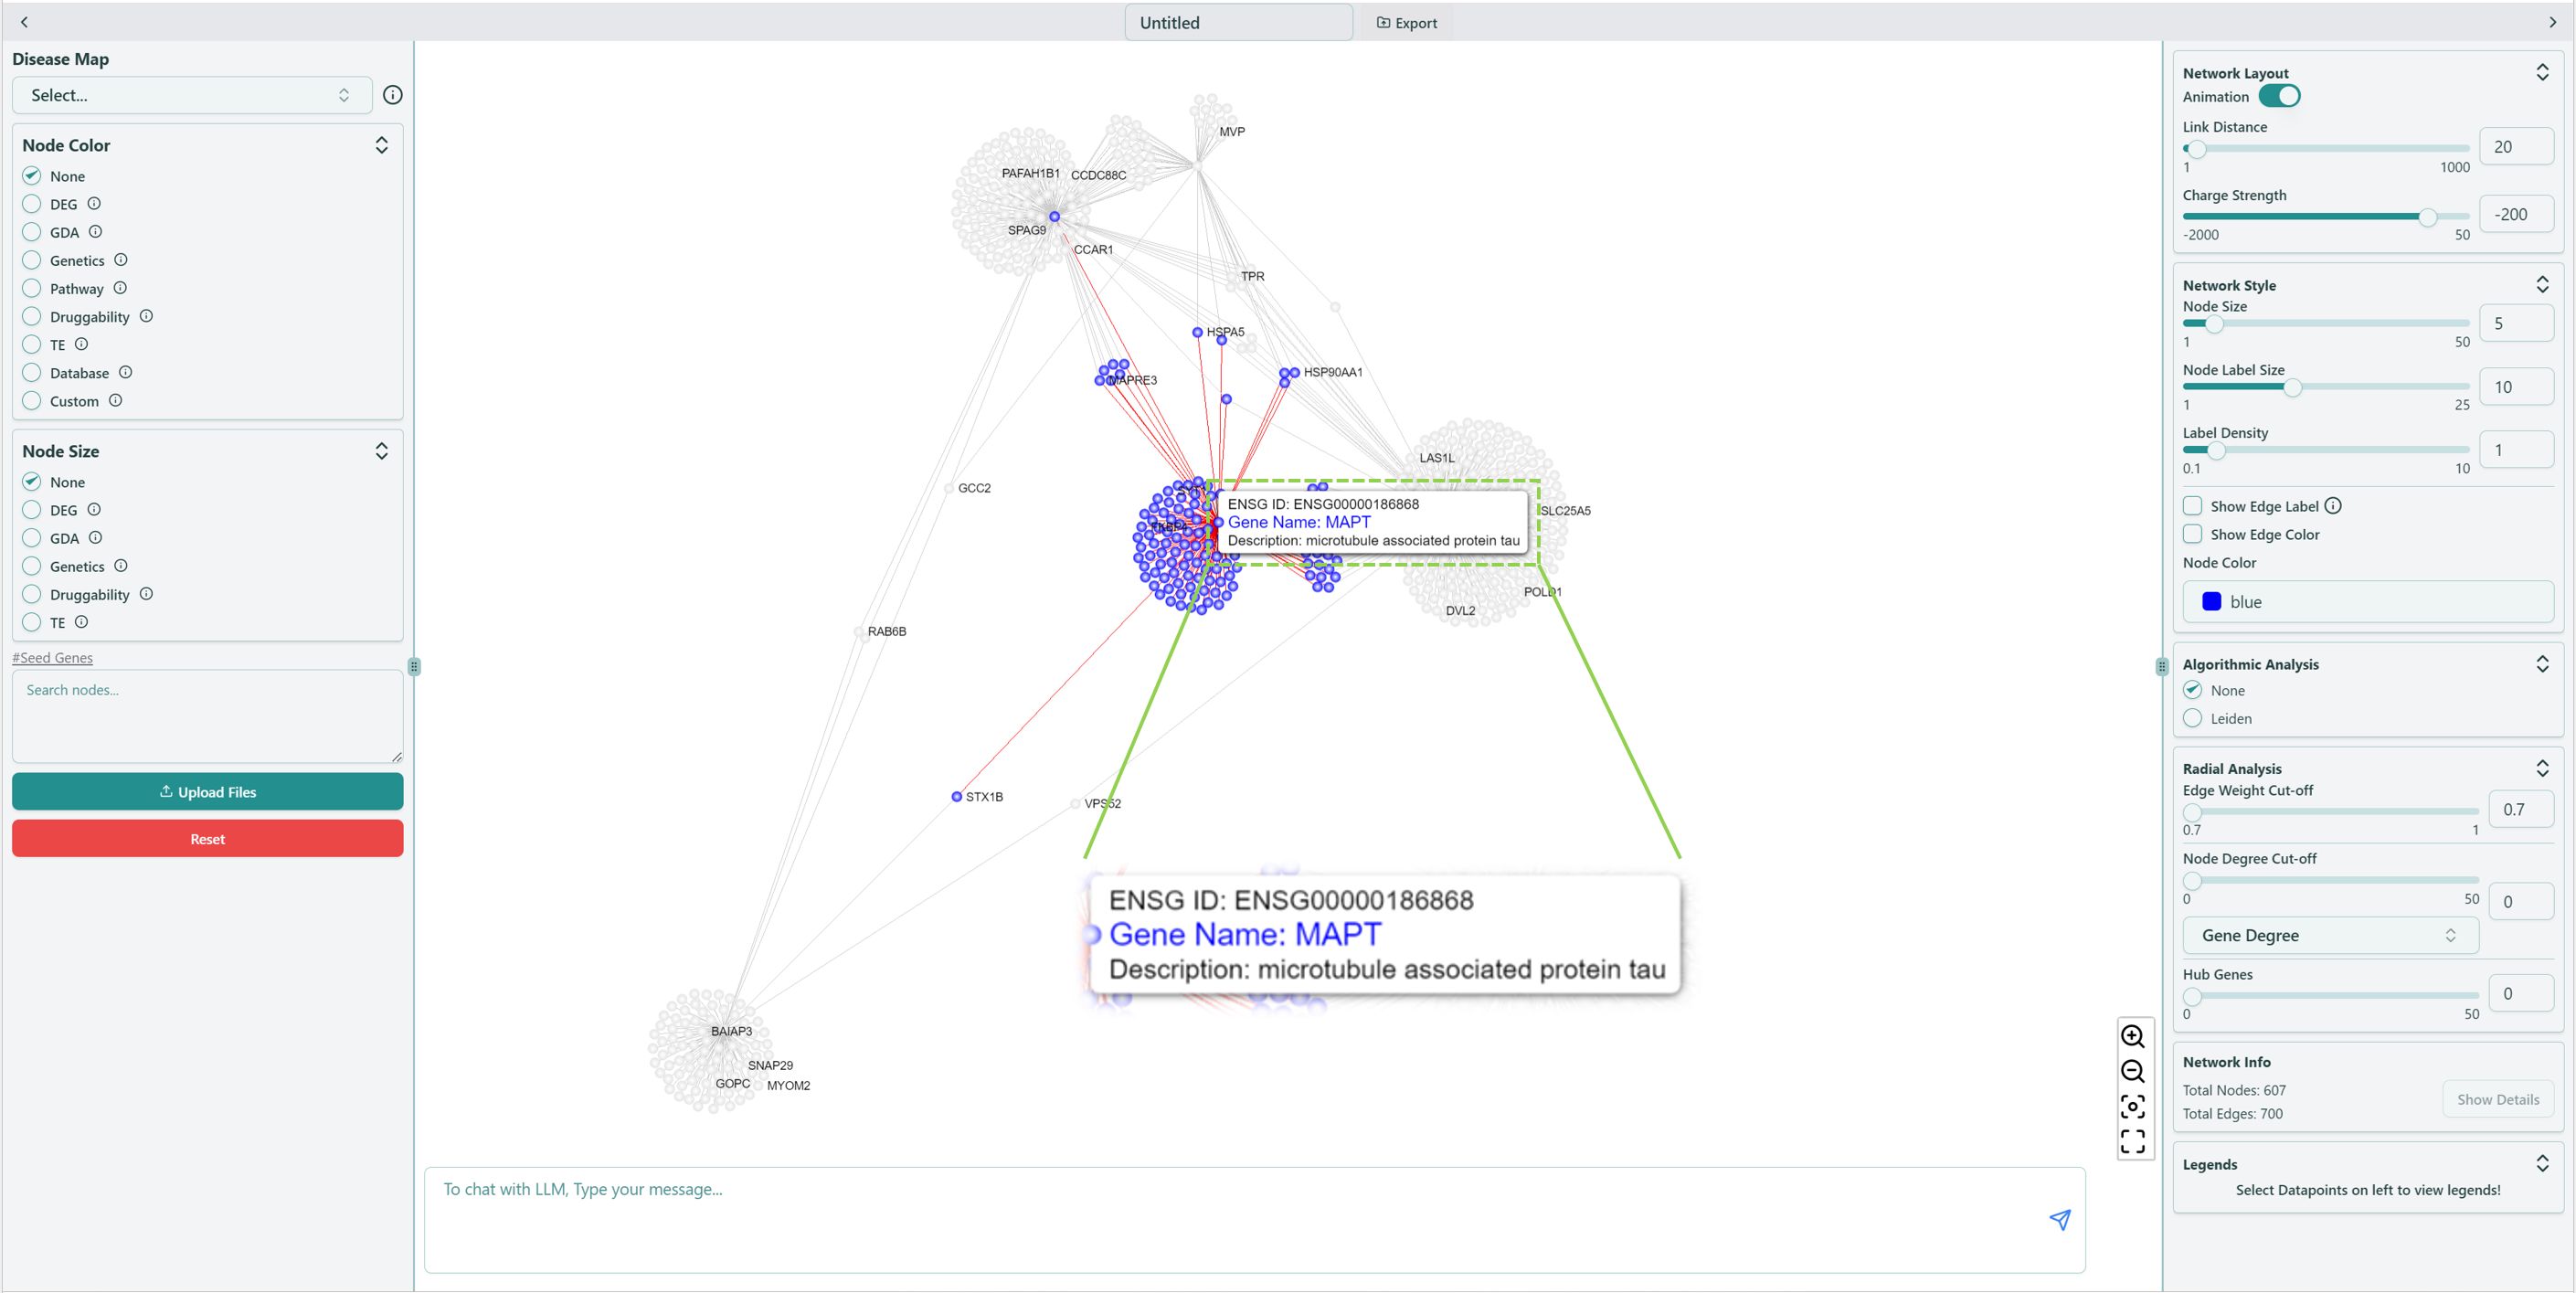 Gene information showing up while hovering/clicking the node
Network visualization page contains the Left panel, Right panel and Network visualization board. Left panel focuses on the functions related to basic analysis of the network, while Right panel focuses on the advanced analysis functions and modifications of inherent network parameters. Network visualization board provides the interactive operations for users to apply various analysis on the network.