Frequently Asked Questions
-
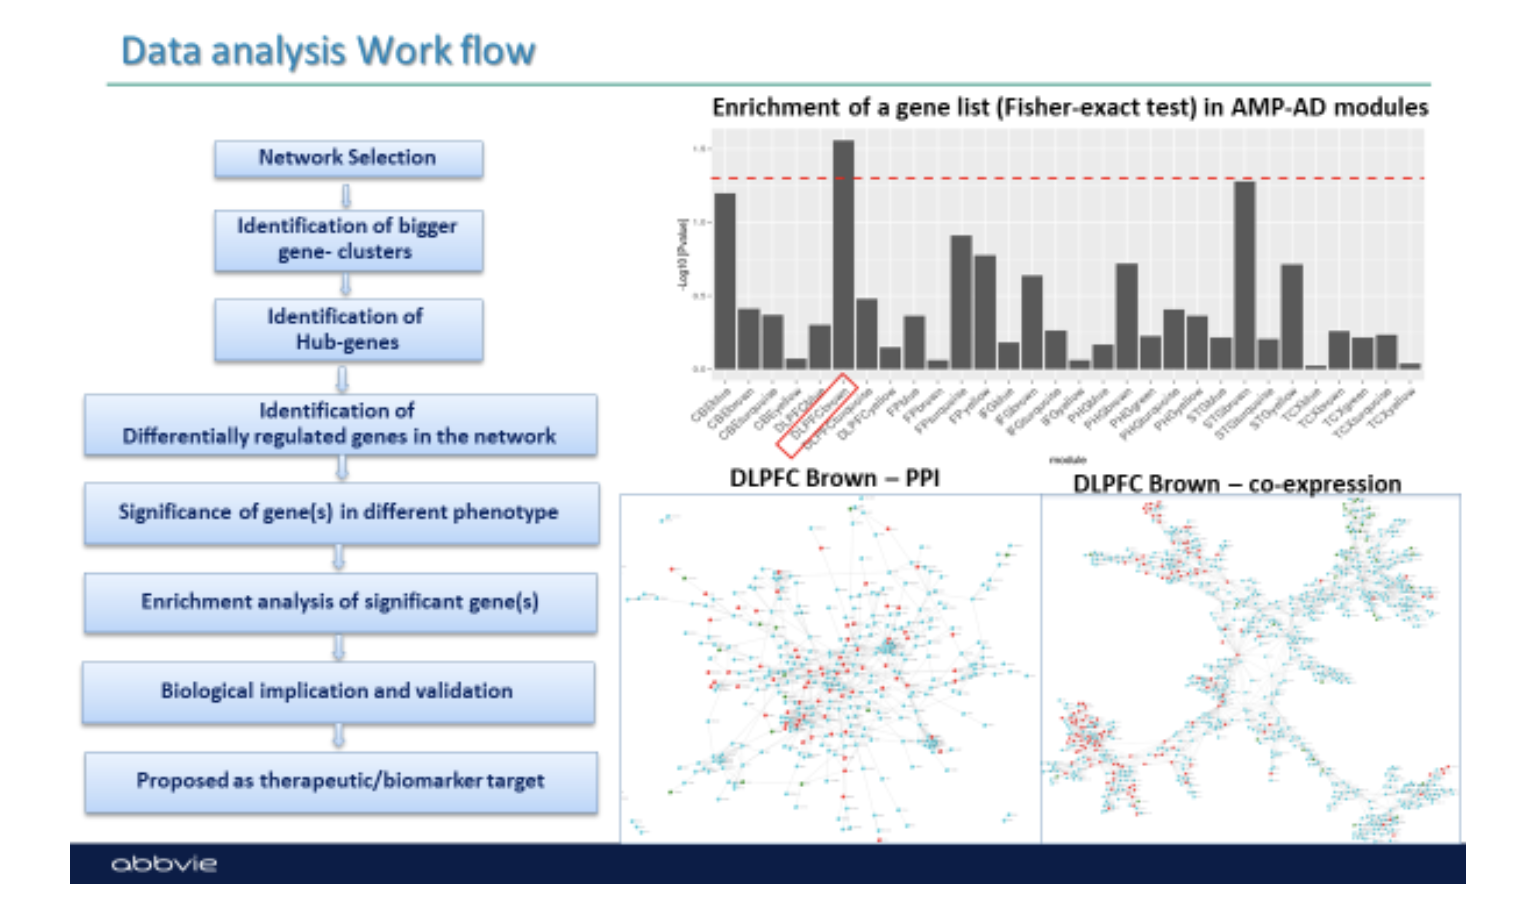
Question: What is the workflow of using PMAP? How should we use PMAP?
Below is a typical work flow of analysis using PMAP. For further details, please contact Gyan Srivastava (gyan.srivastava@abbvie.com).
-
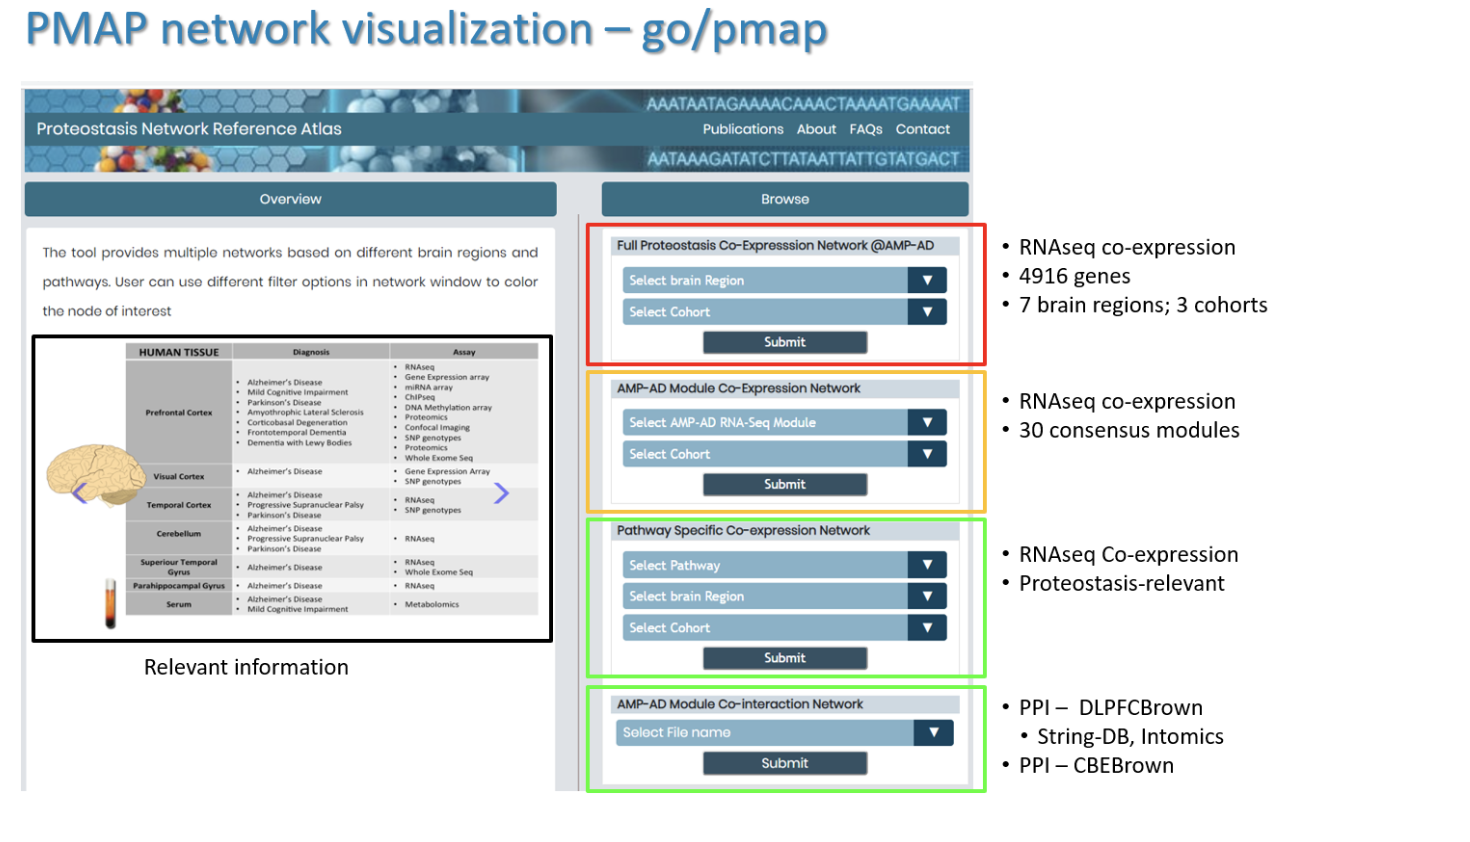
Question: which network I should use for analysis?
For a given gene list, user can do enrichment test to select significantly enriched networks. Please contact Gyan Srivastava (gyan.srivastava@abbvie.com) for further details.
As shown below, there are multiple type of networks already populated in the PMAP database. As the complexity of the network analysis is proportion to square of network size, it is recommended to avoid larger networks for analysis e.g. full proteostasis networks consisting of ~5000 genes or large size AMP-AD modules as shown in the information slide in the left panel.
-
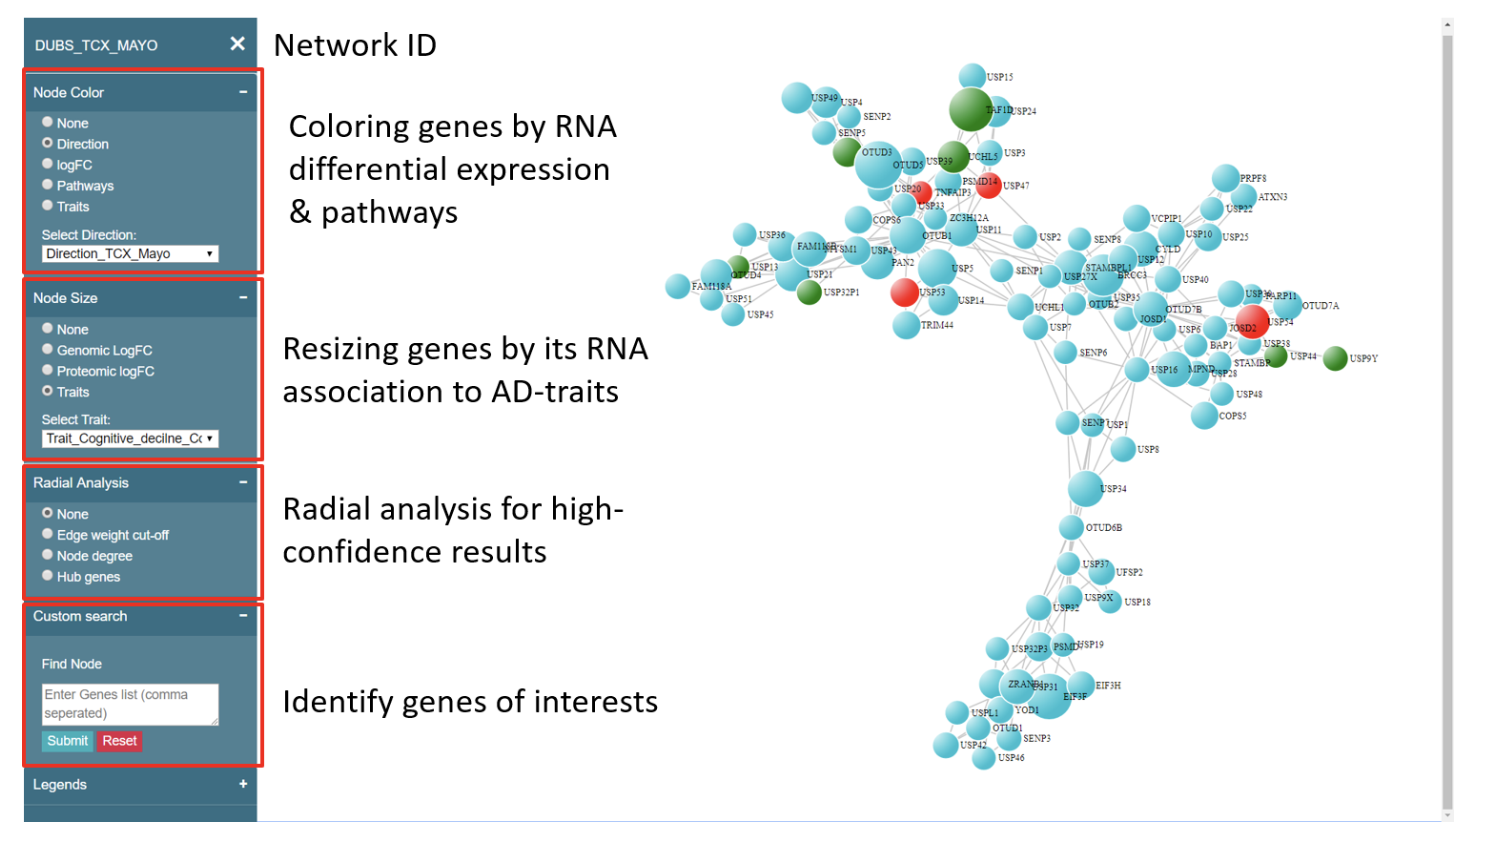
What kind of analysis can be performed in PMAP?
Following figure explains various option of integrating information to a selected network from PMAP. These options are applicable and consistent to any selected network. Once user understands these options, he/she can apply these results to any network.
Here we provide an example of network analysis using PMAP. In particular, we are using an AMP-AD module “DLPFCBrown” to show various steps of analysis and derived scientific knowledge.
-
Example PMAP analysis using AMP-AD network module
Here we provide an example analysis of an AMP-AD module to discover hot-spots in the network and deep divining the hub-genes. For illustration purpose, we chose “DLPFCBrown” AMP-AD module, which is highly associated with amyloid pathology. We created a functional protein-protein interaction network amongst those genes derived from string-DB database.
A deep-dive into the network shows hot-spots of biological interest. For example, we identified clusters of E3 ligases and adapters as well as endocytosis but not lysosomes or autophagy-related genes (Figure 2a).
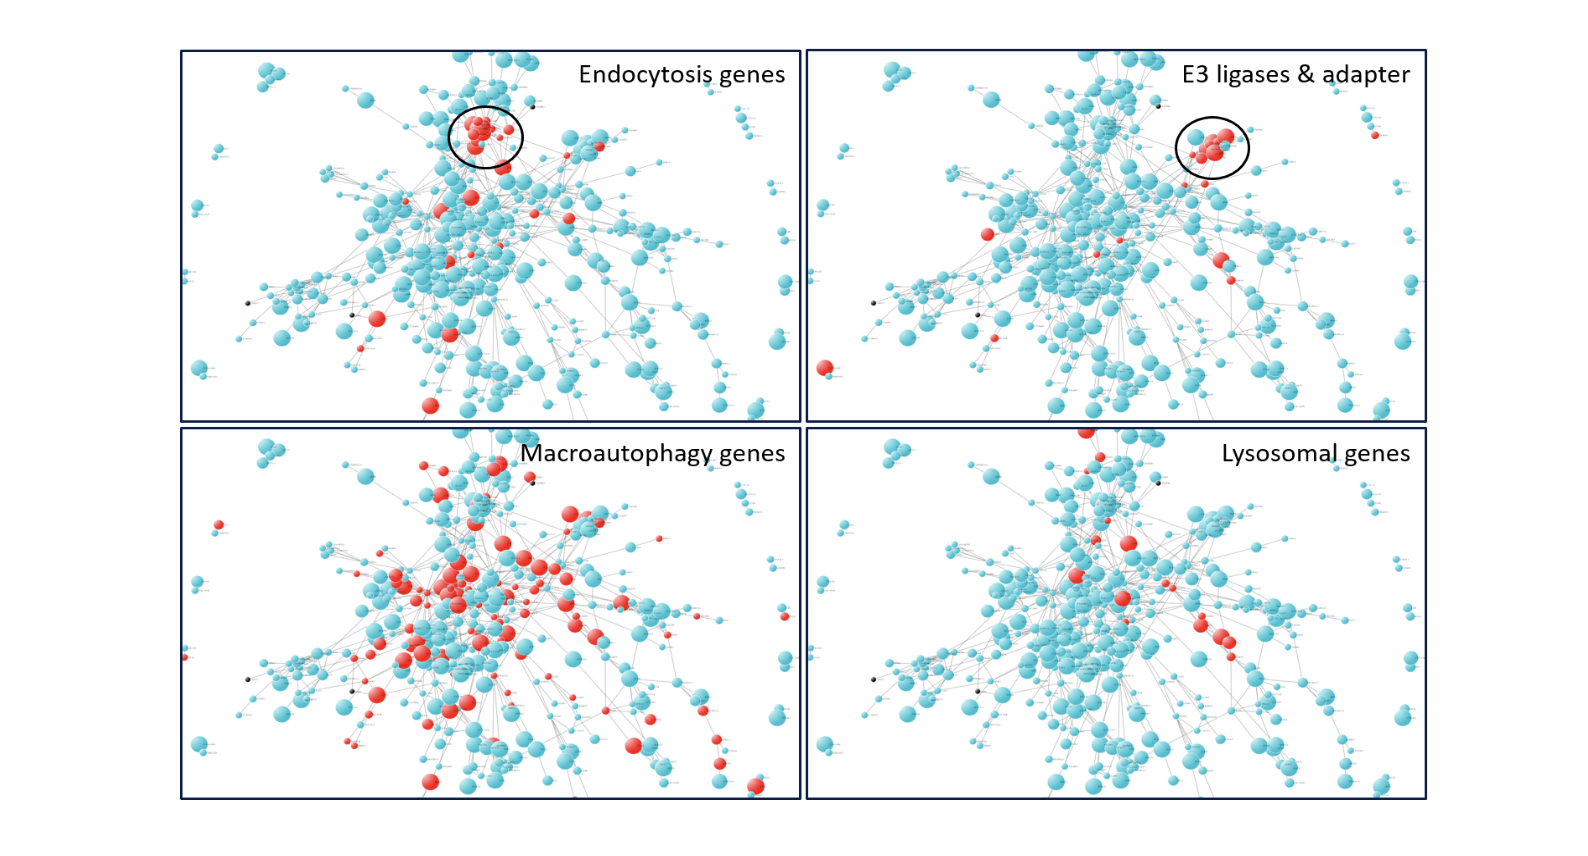
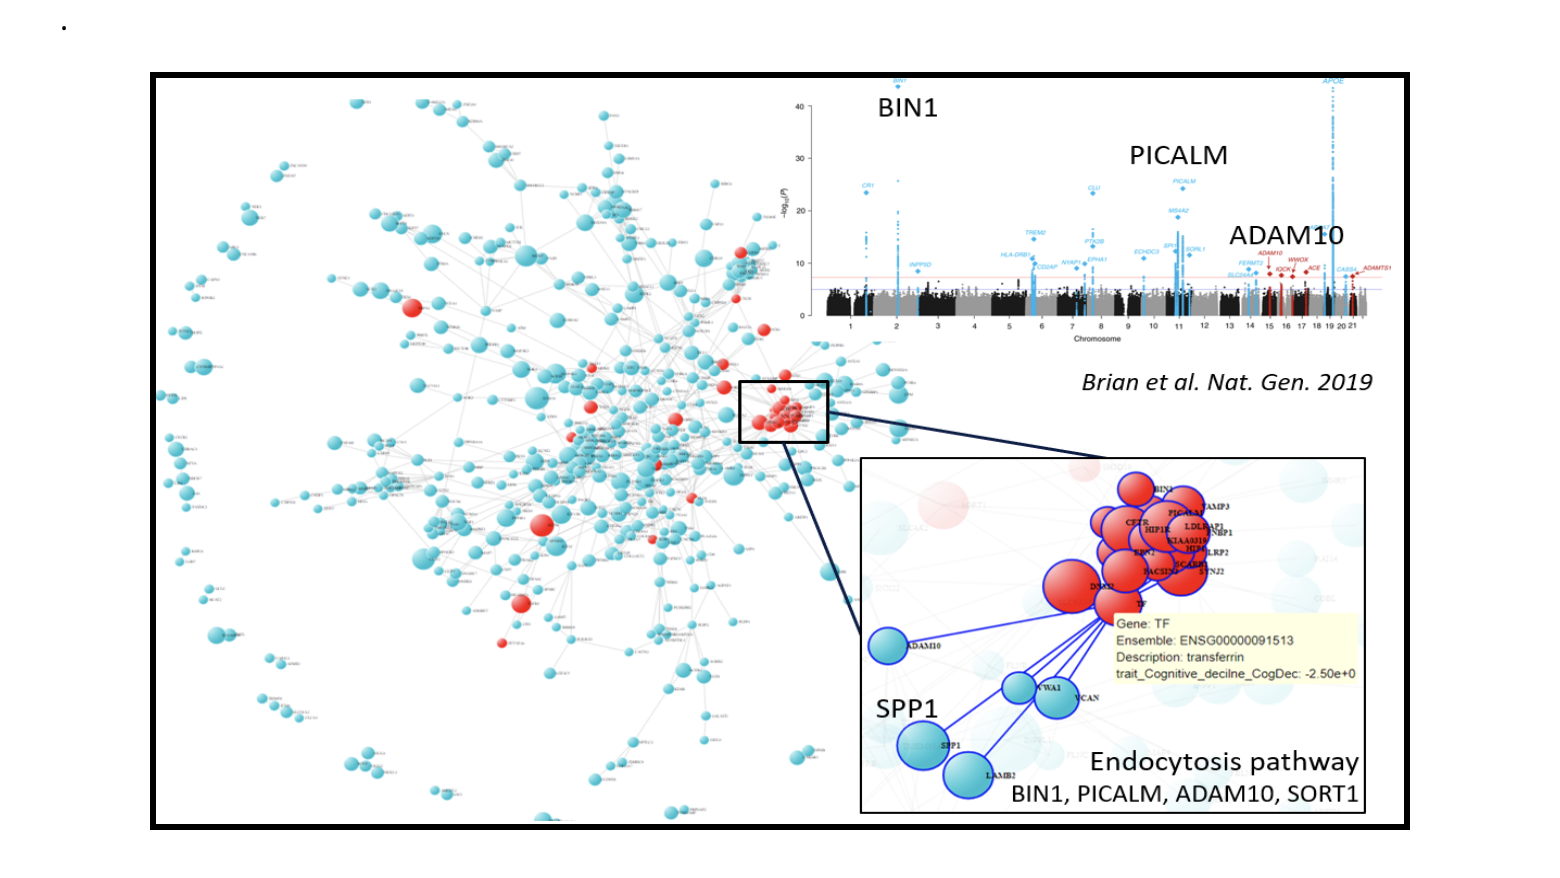
Figure 2: PPI network of 882 genes from DLPFCBrown module, A) DLPFCBrown module PPI network labeled with other pathway genes in red color e.g. macroautophagy, lysosome etc. B) Genes involved in endocytosis pathways are shown in red color.
We mapped differential expression summary on the network. As shown in Figure 3, many genes from this module are up-regulated in temporal cortex compared to cerebellum of AD patients. Given the fact that temporal cortex is highly affected in AD whereas Cerebellum is spared, these differences indicate region and disease-specific pathway activity of these genes. Moreover, genes that are down-regulated in cerebellum but not changed in temporal cortex of AD brain might be related to protective mechanism of this brain region against AD progression.
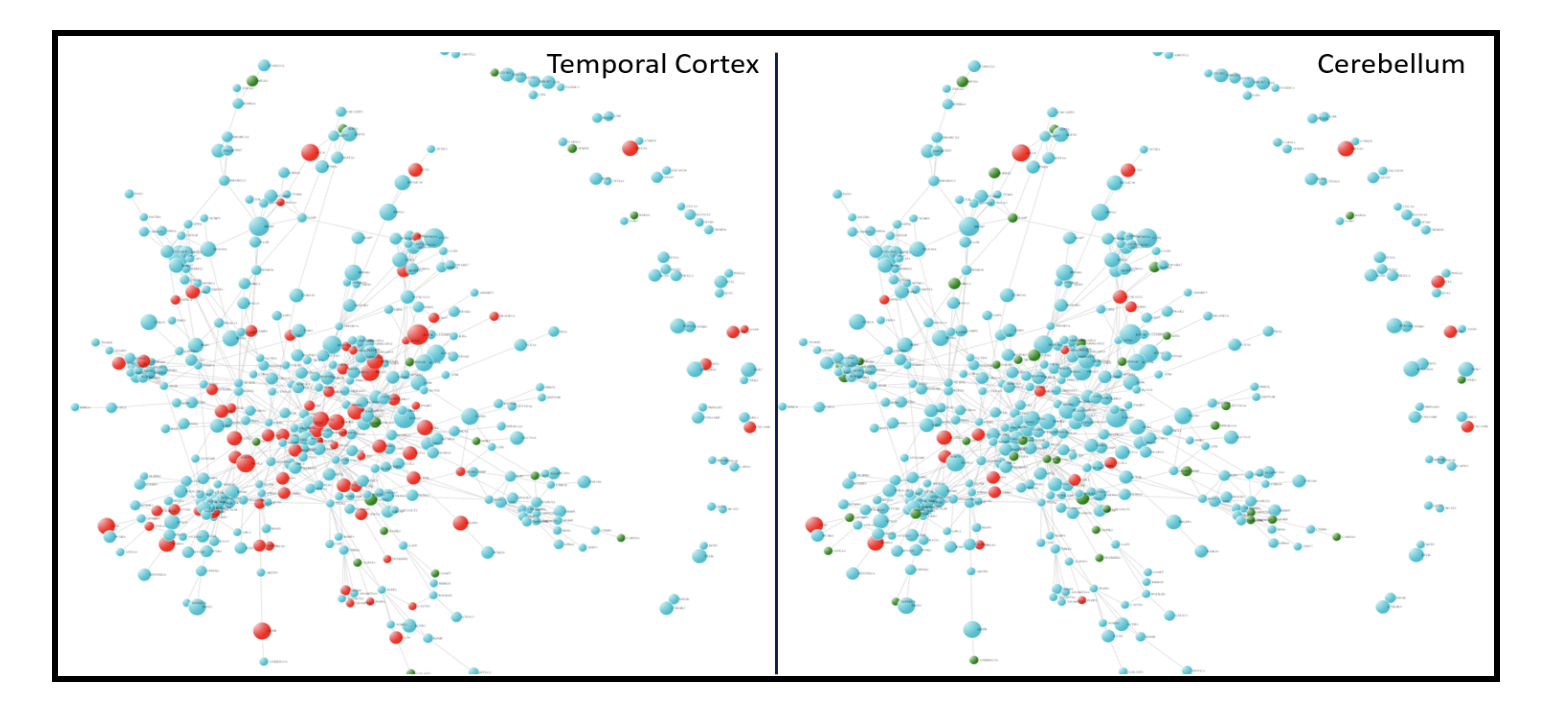
Figure 3. Differential expression of DLPFCBrown module in AD vs control. A) temporal cortex B) Cerebellum. Color of a gene represents direction of differential expression i.e. Up-regulation in AD (red); Down-regulation in AD (green). Size of the circle is proportion to association (-log10 P-value) of genes to cognitive decline.
Furthermore, we investigated endocytosis cluster and interacting partners of ADAM10 from this network. We mapped differential expression summary derived from 6 brain regions (Figure 4) and AD traits association P-value (Figure 5). The cluster shows brain region specific changes at transcriptional level. Interestingly, SPP1 is the only gene up-regulated in all 4 brain regions whereas other genes like NOTCH1 and DLL1 are up-regulated in temporal cortex but not in other brain regions.
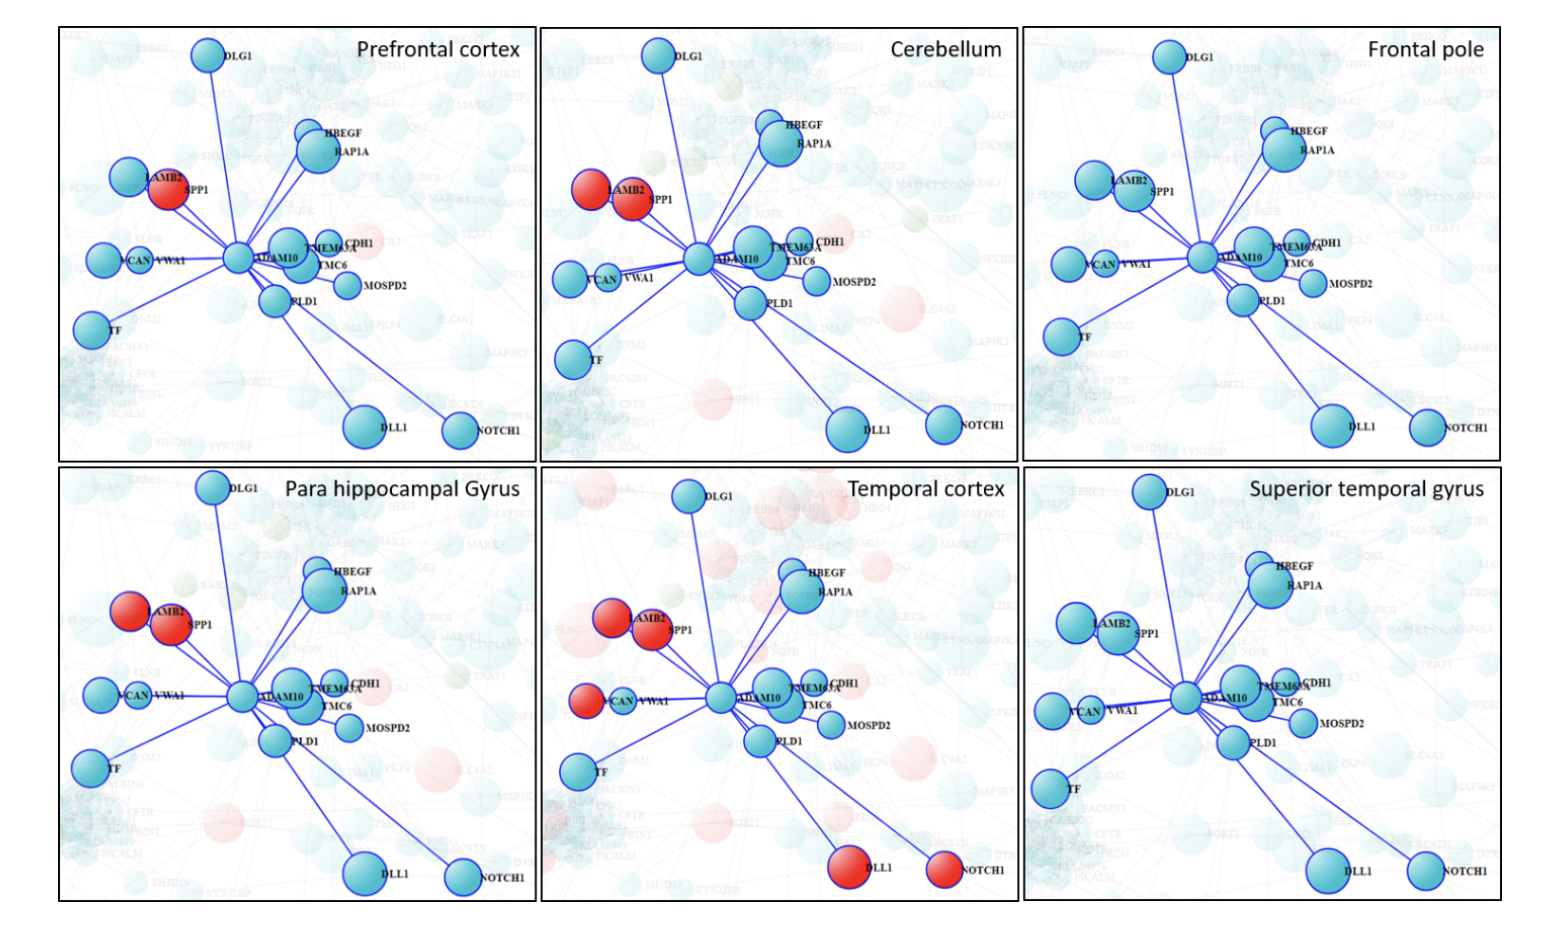
Figure 4. Transcriptional changes atlas of Hub-gene ADAM10 and its direct interactors. Size of the circle is proportion to association of genes to cognitive decline, whereas color of the genes shows differential expression in RNAseq
Additionally, ADAM10 transcriptional changes are more associated with amyloid-plaques than neurofibrillary tangles. However, direct interactors of ADAM10 shows different level of association to AD traits. Specifically, SPP1, TMC6, RAP1A and NOTCH1 are strongly correlated to amyloid-plaque and cognitive decline but not with neurofibrillary tangles. In contrast, LAMB2 shows a similar level of association with both amyloid and tau pathology as well as cognitive decline.
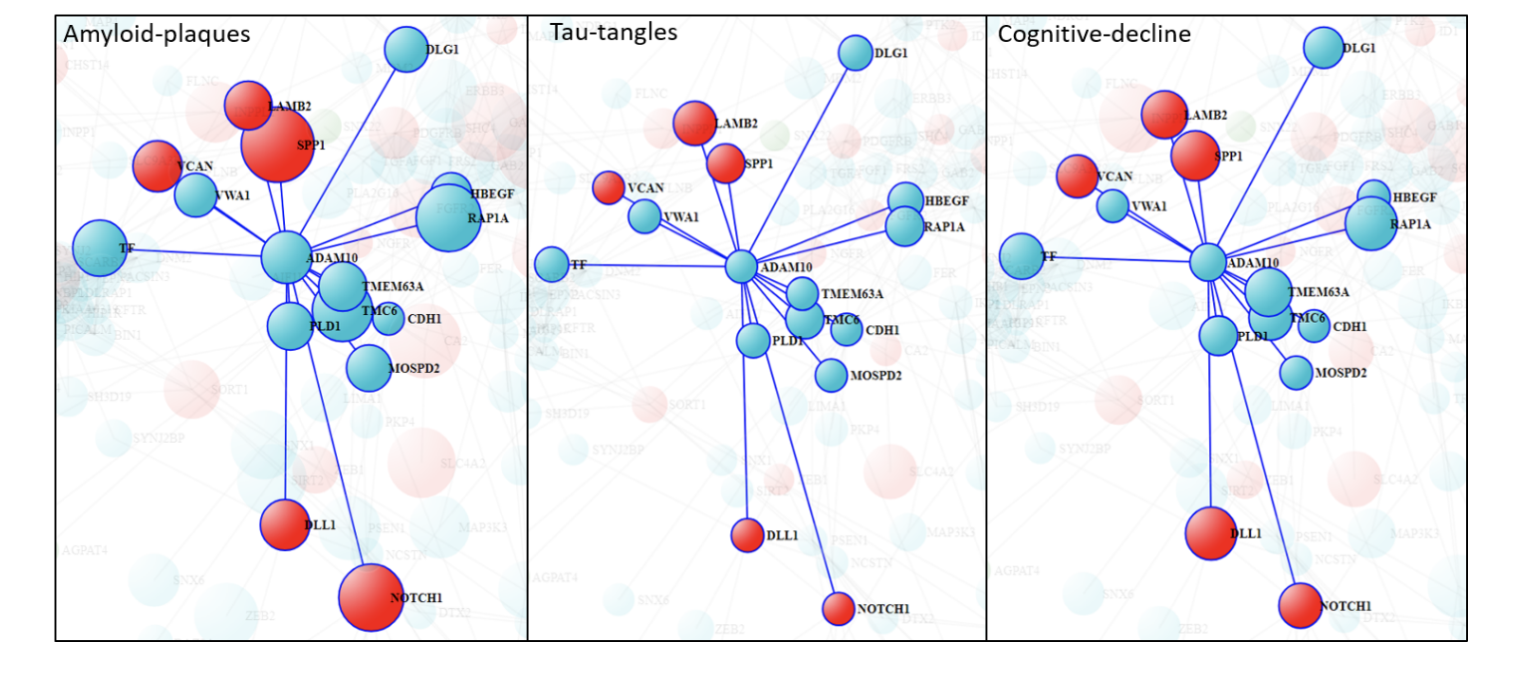
Figure 5: Hub-gene ADAM10 and its direct interactors. Size of the circle is proportion to association (-log10 P-value) with AD-traits. Color represents Up (red) or Down (green) regulation of the genes expression in temporal cortex of AD brain.
-
What species are covered in The Proteostasis Network Reference Atlas (PNRA)?
Currently, the Proteostasis Network Reference Atlas is focused on Human genes and their Alzheimer’s association. Data from other animal model will be incorporated in future versions of the tool.
-
Can user see their own gene network in Proteostasis Network Reference Atlas (PNRA).
Ans: Yes, user can upload an input in given format and visualize the network and analyze the network’s gene assoction with other available data at Proteostasis Co-Expresssion Network.
-
How interconnection is established between two genes?
The data from different modules were analyzed using correlation network analysis with the help of Multiscale Embedded Gene Co-expression Network Analysis package (Link: https://doi.org/10.1371/journal.pcbi.1004574 | References)